






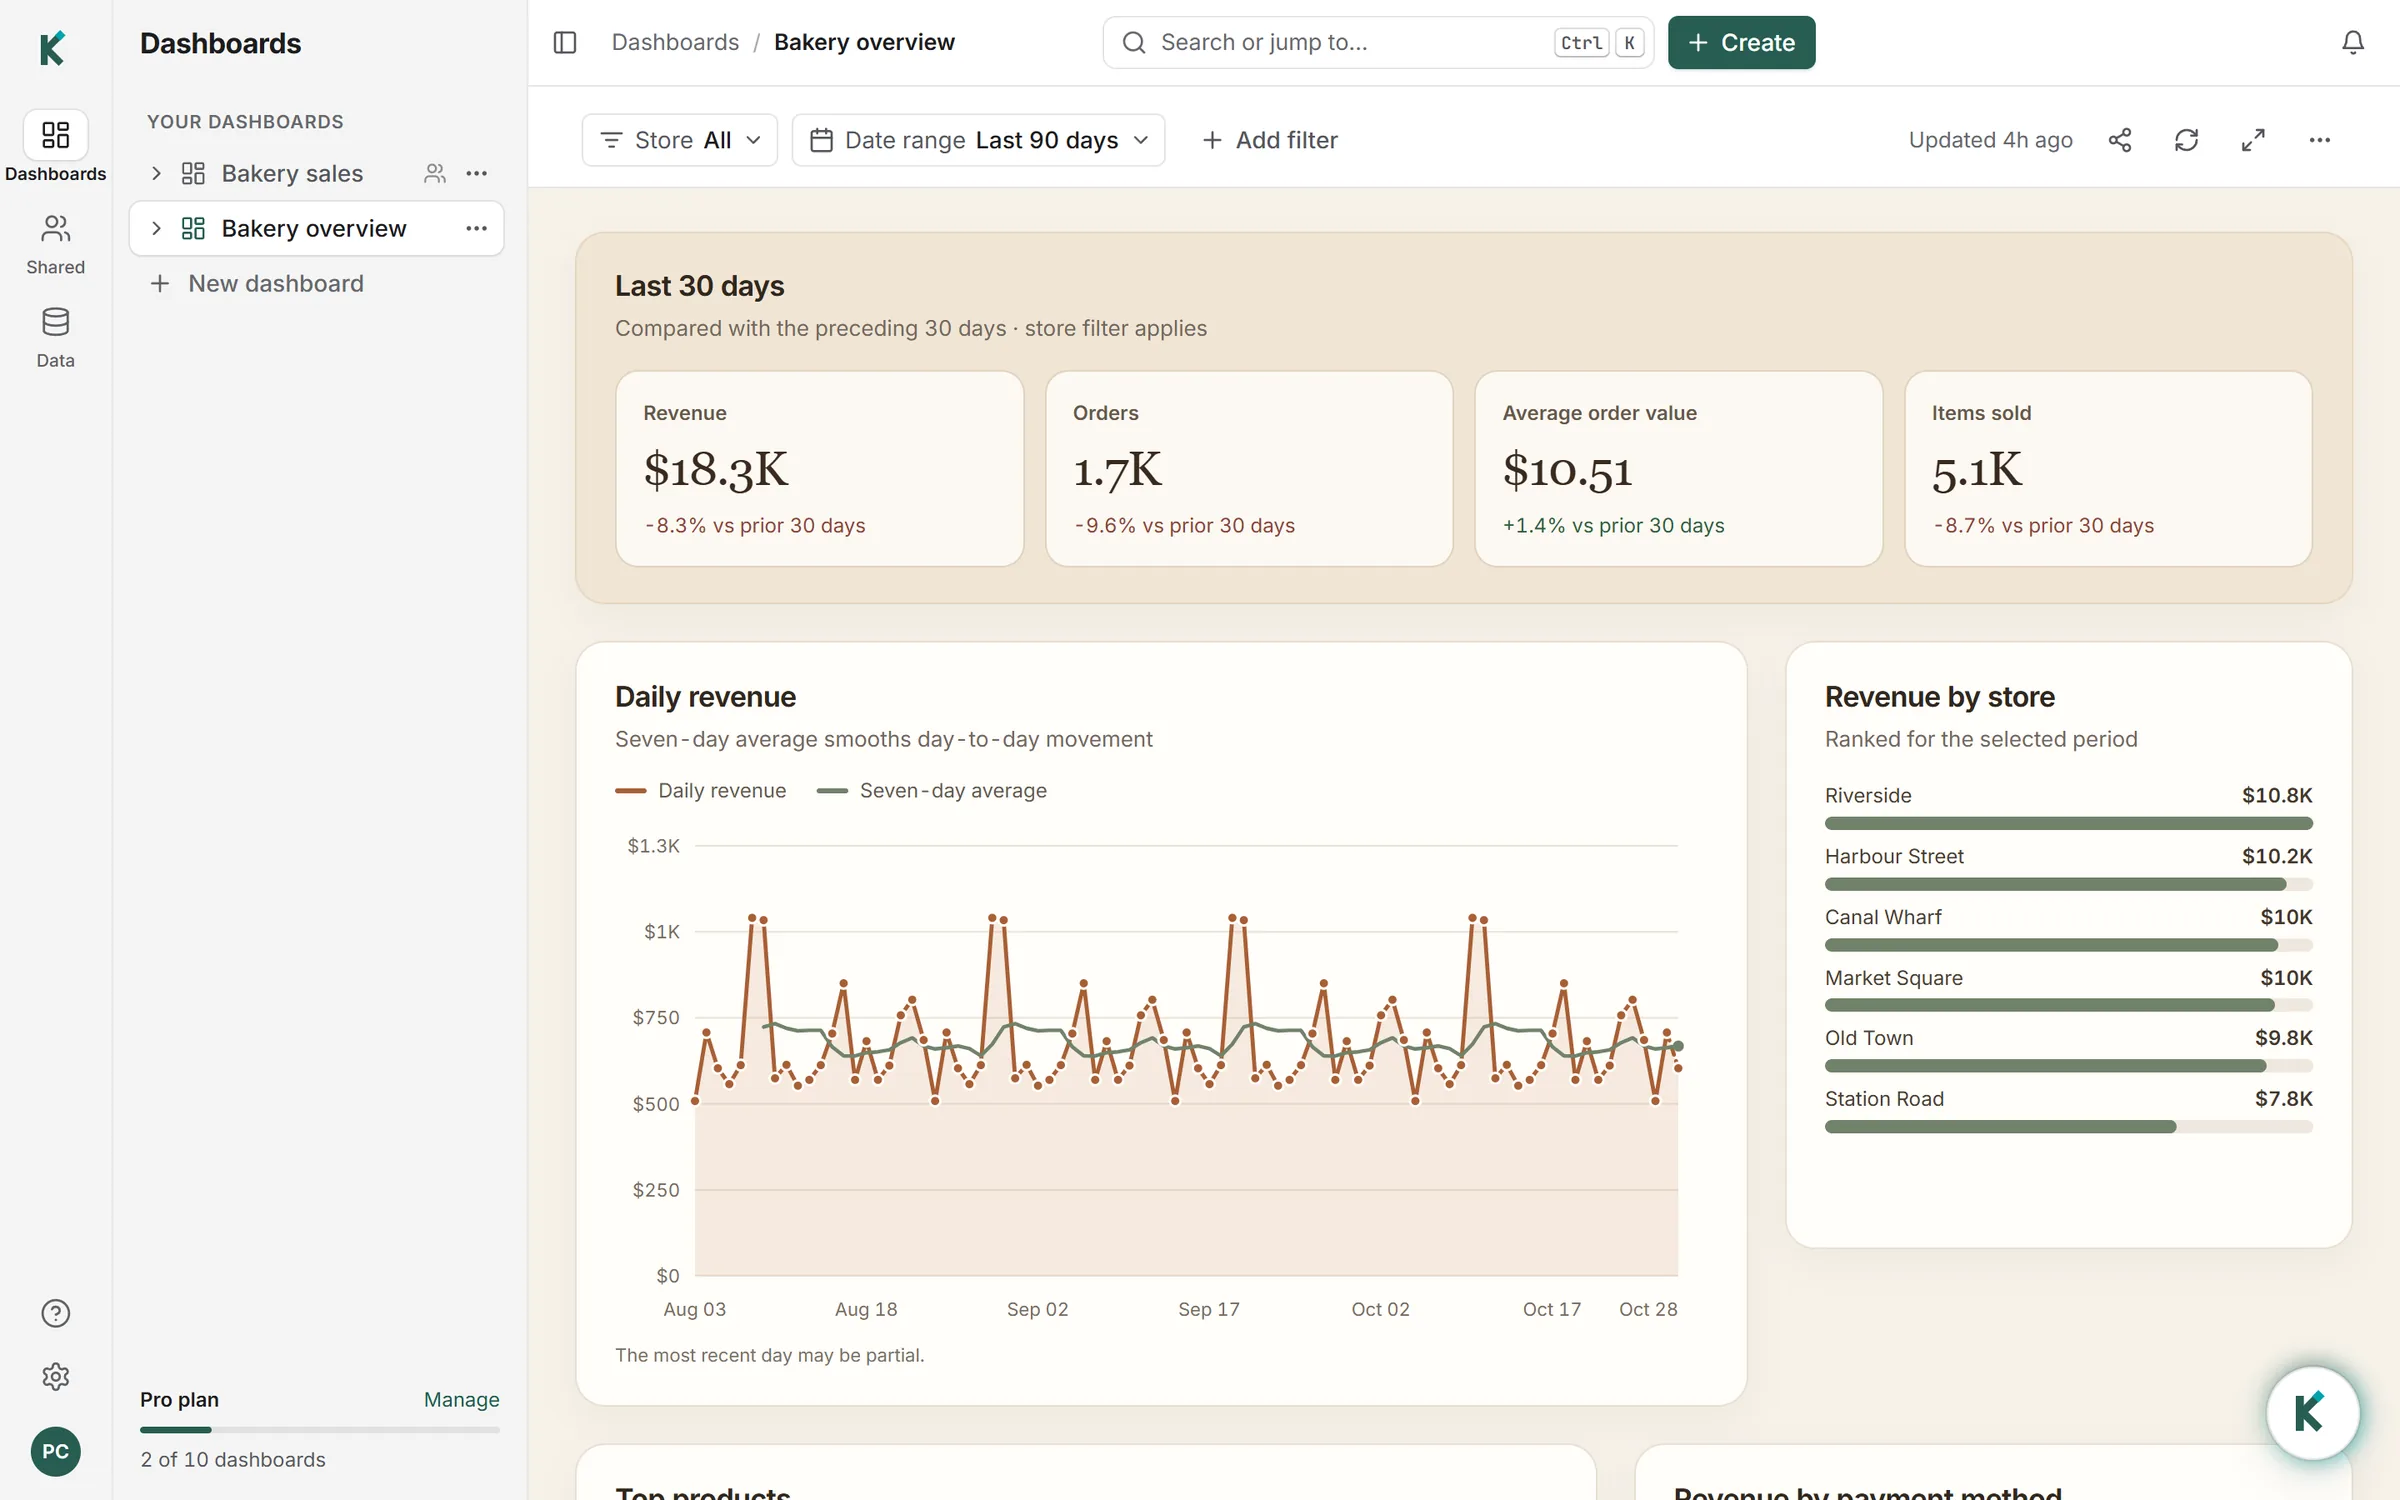
What an AI dashboard is
An AI dashboard is a dashboard that an AI agent builds for you from a request in plain language. Instead of dragging fields onto charts, you describe the question ("revenue by store for the last 90 days, with the weekly trend and the slowest-selling products") and the agent finds the right tables, writes the SQL, checks the results and lays out the charts and tables.
Most AI dashboard tools stop there: they generate a picture of today's answer. Klyrova keeps the query behind every number. Each chart and table is drawn from a named dataset, and each dataset stores the exact call that produced its rows. When the dashboard refreshes, Klyrova replays those calls against your database. The model that wrote them isn't asked again, so the dashboard doesn't drift, doesn't cost AI credits to refresh, and can run on a schedule while nobody is signed in.
How Klyrova builds one
- You connect your data. PostgreSQL, SQL Server, Azure SQL Database or Microsoft Fabric; files you upload (CSV, Excel and JSON become tables you can query); and apps: Jira, Smartsheet and any REST API, read like a database: live or imported, as you choose for each dashboard.
- You pick the tables. Klyrova suggests the ones that belong together, using your foreign keys, and turns them into a small data model with the relationships already drawn.
- You ask. The agent inspects the schema, writes read-only SQL, runs it, and looks at what came back before it decides what to show.
- It writes the page. One dashboard page, laid out for the data you have: figures, charts, tables of millions of rows that page and search, and filters that reach into every query.
"Build me a sales dashboard: revenue by month for the last year, the top ten products, and a table of every order I can search."
Klyrova saved three datasets, each a read-only query with a name, and drew the page from them. The monthly revenue dataset, for example:
SELECT DATE_TRUNC('month', o.ordered_at) AS month,
               SUM(l.quantity * l.unit_price)     AS revenue
        FROM   model.orders o
        JOIN   model.order_lines l ON l.order_id = o.id
        WHERE  o.ordered_at >= CURRENT_DATE - INTERVAL '12 months'
        GROUP  BY 1
        ORDER  BY 1;
You can open any dataset to read its SQL, see when it last ran and which filters it follows, and export what it returns to Excel or CSV.
Change it by asking
There's no grid of widgets to drag around. To change a Klyrova dashboard you ask for the change: "put the table first", "show this as a weekly bar chart", "add a store filter that defaults to all stores", "use our brand colours". The agent edits the page and its datasets, and you see it redraw as it works.
Filters are real query parameters, not a filter applied to rows already fetched. When someone picks a store or a date range, every dataset that follows that filter runs again with the new values bound by the database driver, so totals and averages are recalculated, not just hidden.
Why the refresh doesn't use AI
Using a model to rebuild a dashboard each time it refreshes is slow, costs money on every run, and can give a slightly different answer each time. Klyrova splits the two jobs:
- Building uses the AI agent, once, while you're in the conversation.
- Refreshing replays the stored queries. It costs no credits, takes as long as your queries take, and gives the same answer the same data would give a person running the SQL by hand.
Dashboards can refresh on a schedule (once a day on the Free plan, as often as every five minutes on Pro and Teams), and the latest rows are kept so the dashboard opens on real data instantly. On Pro and Teams you can also import a data model into a fast copy up to eight times a day, so filters answer in milliseconds even on a slow database.
Safe to point at a production database
Every query the agent writes goes through Klyrova's read-only check before it reaches your database: one statement, a SELECT or WITH, nothing that writes, waits or reaches another server. On SQL Server the statement is parsed, not pattern-matched, and on PostgreSQL every query also runs inside a read-only transaction that is rolled back. We still recommend connecting with a read-only database user. More on how this works on the security page.
Share it, publish it, export it
- Share a dashboard with viewers or editors. They use it with your connection, but never see your password.
- Publish it on Pro or Teams as a public link or a private one that asks people to sign in, and embed it in your own app or site.
- Export the whole page as a PDF, or the rows behind any section to Excel or CSV.
- White-label it on Teams: your own address, logo and colours on every dashboard and email. See white-label AI dashboards.
Where Klyrova fits
Klyrova suits people who know what they want to see and have the data in a SQL database or a spreadsheet, but don't want to spend a week in a BI tool to get there: founders, operations and finance leads, analysts who want a first draft fast, and software teams who want dashboards inside their own product. If your organisation already runs a governed BI platform with hundreds of curated reports, Klyrova works best beside it, for the questions that platform doesn't answer yet. See how it compares in Klyrova as a Power BI alternative.
Questions about AI dashboards
Do I need to know SQL to build an AI dashboard?
No. You describe what you want in plain language and the agent writes the SQL. If you do know SQL, you can read every query it wrote, and ask it to change one.
Does refreshing a dashboard use AI credits?
No. Building and changing a dashboard in the chat uses credits. Refreshing it, on a schedule or by hand, and picking filters replay the stored queries without any AI model, so they cost nothing.
Which databases can Klyrova build dashboards from?
PostgreSQL, Microsoft SQL Server, Azure SQL Database and Microsoft Fabric (warehouses, lakehouse SQL endpoints, SQL databases, mirrored databases and KQL databases), uploaded CSV, Excel and JSON files, and apps: Jira, Smartsheet and any JSON REST API.
Can I build the dashboard myself instead?
Yes. Choose Build it myself for a report you lay out by hand in the report builder, with 26 visual types including maps. The agent can still help there.
Can the AI change or delete my data?
Klyrova only reads. Its read-only check refuses anything but a single SELECT or WITH statement before it reaches your database, and PostgreSQL queries also run in a read-only transaction. Connecting with a read-only database user adds a second lock.
Which AI model does Klyrova use?
Klyrova runs the AI for you on leading AI models, so there are no API keys to manage. You pay for chats in Klyrova credits; every account starts with 500.
How much does it cost?
The Free plan includes two dashboards, one data source and 500 credits to start. Pro is $18 a month for ten dashboards, five sources, refreshes every five minutes, publishing and 500 credits a month. Teams is $28 a person a month and adds your own branded address. See pricing.
Updated 16 November 2026