






What a semantic layer is
A semantic layer, or semantic model, is a set of business definitions that sits between raw tables and the people and tools that ask questions of them. It says which tables matter, how they join, and what words like "revenue", "active customer" or "order date" mean, so every report computes them the same way. For an AI agent it is the difference between rediscovering your schema on every question and starting from what your team already agreed.
In Klyrova the semantic layer is called the data model. It holds definitions only. Nothing is copied unless you choose to import it, and every query still runs against your own database.
What a model holds
| Part | What it is |
|---|---|
| Views | A named SELECT on one data source, such as orders with cancelled orders left out, or customers with the region cleaned up. Up to 25 per model. |
| Measures | An aggregate over a view's columns, defined once: revenue, margin, average_basket. Write it as a formula in a familiar spreadsheet style, such as DIVIDE(SUM([amount]), COUNTROWS(orders)), or let the agent write it. Up to 40. |
| Relationships | Links between views through matching columns: one-to-many (every order line points at one order), one-to-one or many-to-many, filtering one way or both ways; a second path between two tables can be kept inactive. Up to 40. |
| Reference tables | Small lists you give Klyrova, up to 500 rows each: targets by month, a mapping of product codes to categories. Up to 10. |
Queries read the model by name. model.orders is the orders view and MEASURE(revenue) is the revenue measure. Klyrova compiles them into plain SQL for your database just before the query runs, so the definitions travel with every query and your database sees ordinary SQL.
A dataset written against the model:
SELECT s.region,
               MEASURE(revenue) AS revenue
        FROM   model.order_lines l
        JOIN   model.orders o ON o.id = l.order_id
        JOIN   model.stores s ON s.id = o.store_id
        GROUP  BY s.region;
If someone later changes what revenue means, say to leave refunds out, this query and every other one using the measure pick up the new definition on their next refresh.
Views can be written as SQL, or shaped step by step in Transform data: filter, merge, group, pivot and add columns, with the steps folded into the view's SQL. Columns and measures can have display names, formats (currency, percent, dates), a sort order and "don't add up" for ids and years, which every report respects.
Built from your foreign keys, then refined
When you create a dashboard you pick the tables it should build on, from one or more sources. Klyrova suggests the ones that belong together by following your foreign keys, makes a view of each table you tick, and turns each foreign key between them into a relationship. The agent then refines the model as it works: a view that cleans a messy column, a measure for a number you keep asking for, a relationship your schema didn't declare.
Every change is tested on the real source before it's saved. A new view is run, a relationship is checked by counting how many rows find their match (and refused if the keys never match), and every dashboard dataset that depends on the change is run again. A change that would break a chart is refused with the chart's name, instead of being discovered by whoever opens the dashboard next.
Filters that follow the relationships
A model filter is defined on a column of the model, such as stores.region. Its choices are read from that column, so a pick always matches the data. When someone chooses a region, the condition is applied inside the stores view, and every view related to stores many-to-one keeps only the rows that point at the stores left: orders for those stores, then the order lines of those orders. A dataset doesn't have to mention the filter to follow it. A chart that should ignore a filter can opt out.
See the model as a diagram
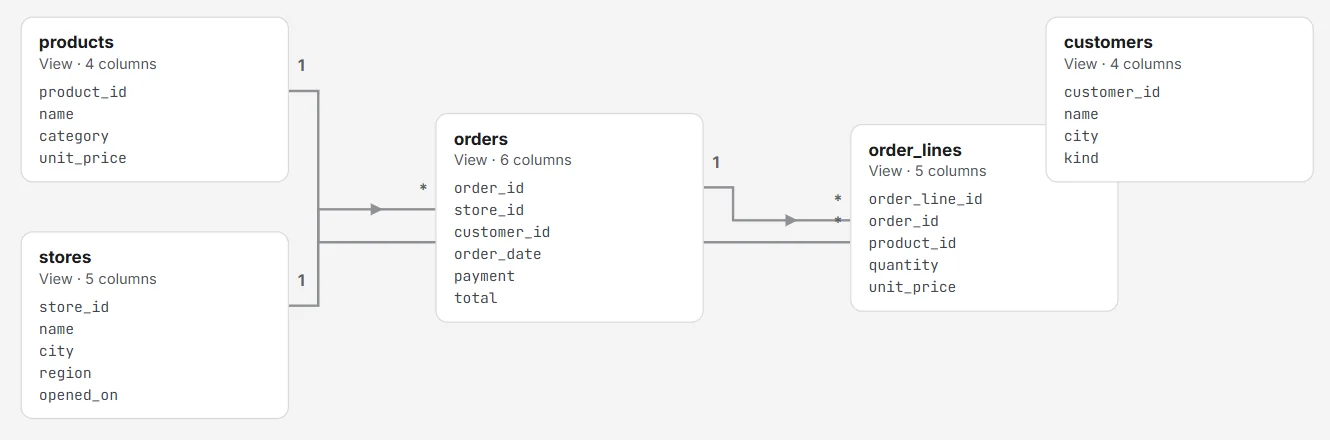
Each model has a page with an overview, its tables, a diagram and its settings. The diagram draws every view and reference table as a box of its columns, and every relationship as a line from the joined column on the "many" side to the one it points at, marked 1 and *, with an arrow showing the way filters flow. Select a line to see both columns, the cardinality and the filter direction.
One model, many dashboards
A model is its own object. Several dashboards can build on the same one, and a change reaches all of them. On a team, the owner can share a model with the team and name who may edit it, so teammates build their own dashboards on the same definitions. A teammate's dashboard reads the owner's data only through the model: the shared definitions, not the rest of the database.
A model can draw on several sources. A single query still reads one source, so charts from two databases sit side by side on a dashboard rather than being joined.
Live or imported
By default a model is live: views are definitions, and their SQL runs inside every query, on every refresh and every filter pick. That keeps the numbers current, but a view that does heavy work does it every time.
On Pro and Teams, a model on PostgreSQL, SQL Server or a connected app (Jira, Smartsheet, a REST API) can be imported into a copy kept inside Klyrova, encrypted, on a DuckDB engine. You choose when imports run: every day or on chosen weekdays, up to eight times a day at the hours you pick, in your time zone, with an email if one fails. Dashboards on the copy answer filters in milliseconds and stop loading your database between imports. Large views are refreshed by their newest rows and checked against the source, with a full import every week. For a database, an estimate of rows, size and time is shown before you switch.
Imported or live, the definitions are the same model: switching changes where queries run, not what they mean.
Questions about Klyrova's semantic layer
Does the semantic layer copy my data?
Not by default. A live model is definitions only, and every query runs on your database. Only if you switch a model to import mode, on Pro or Teams, is a copy kept in Klyrova, encrypted, and refreshed on your schedule.
How does the AI use the model?
The agent sees the model's views, measures, relationships and filters before it writes a query, and writes dashboard queries against model. names and MEASURE() instead of raw tables, so its answers use your agreed definitions.
Which databases can a model be built on?
PostgreSQL, SQL Server, Azure SQL Database, Microsoft Fabric's SQL sources and uploaded files. Import mode is available for models on PostgreSQL and SQL Server sources, including Azure SQL.
Can several people share one model?
Yes, on a team. The model's owner shares it with the team and chooses editors; everyone on the team can build dashboards on it, and only editors change it.
Is this the same as a Power BI semantic model?
The idea is similar: tables, relationships and measures defined once and reused. Klyrova's model is plain SQL, measures are SQL aggregates rather than DAX, relationships are always many-to-one in one direction, and the AI agent builds and maintains it with you. See Klyrova as a Power BI alternative.
Updated 16 November 2026