






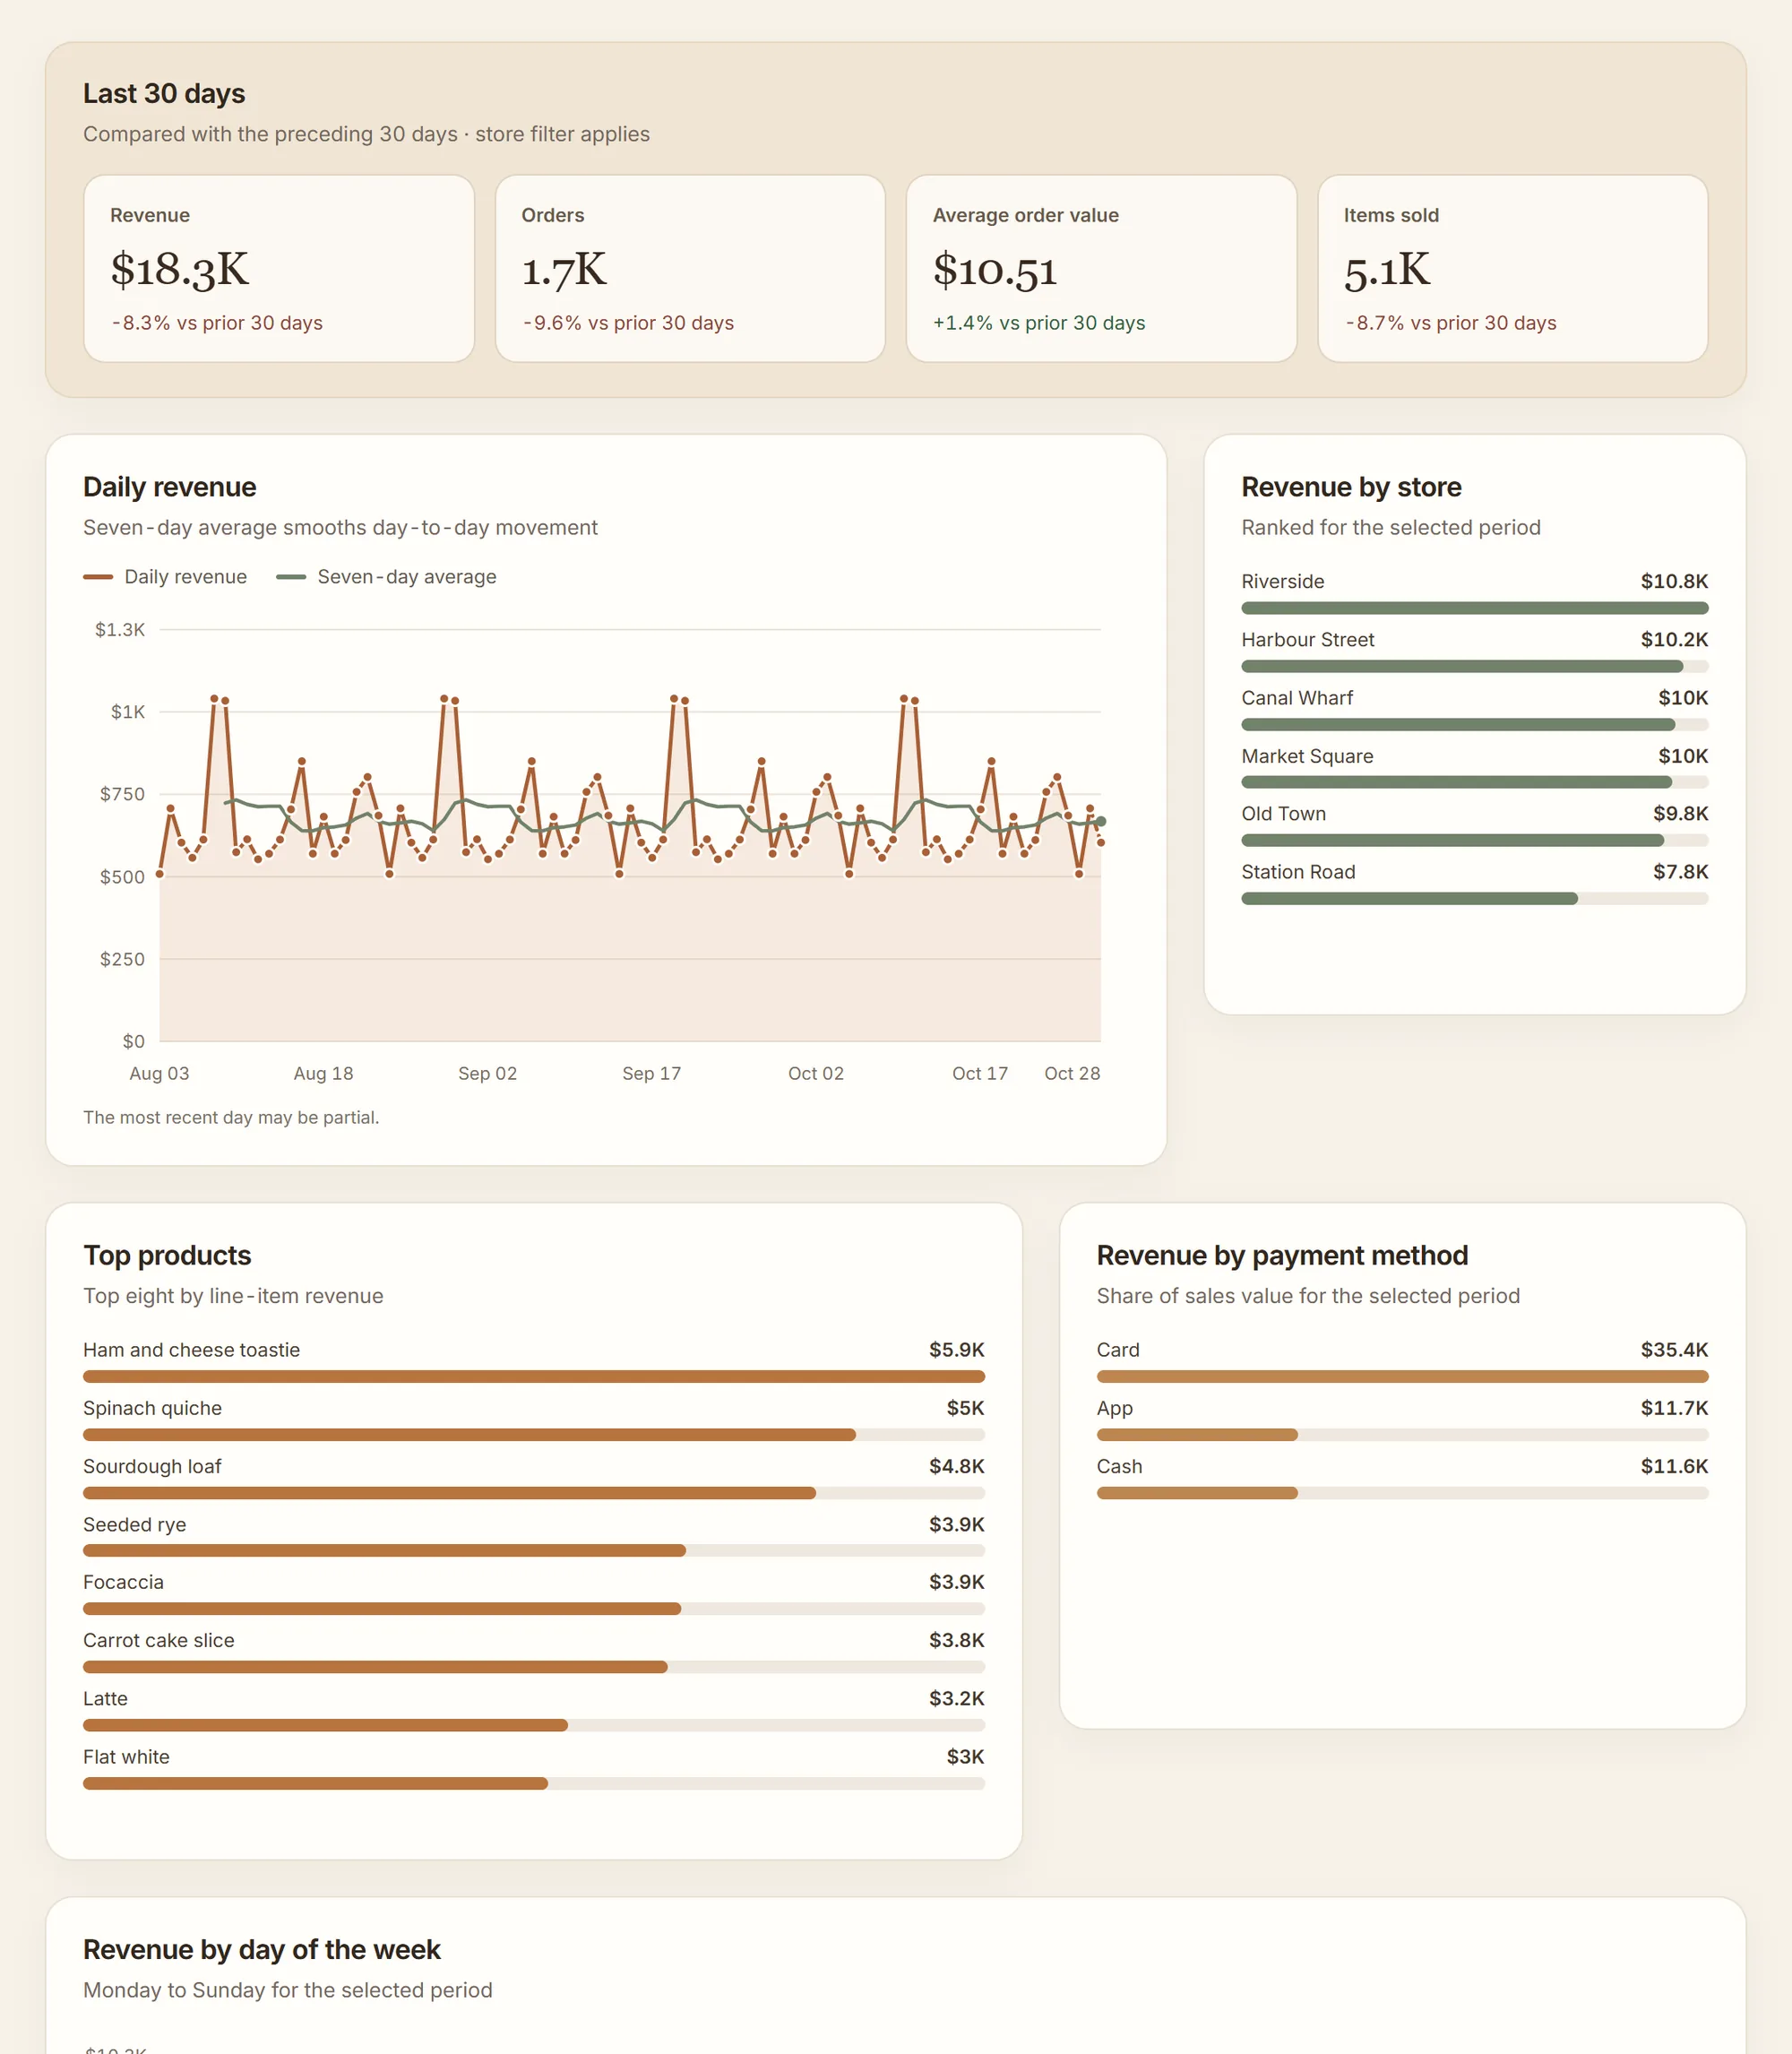
What an AI report generator does
An AI report generator turns a request in plain language into a finished report: it finds the data, writes the queries, checks what they return and lays out the figures, charts and tables. The difference between tools is what happens afterwards. A one-off answer is a snapshot you have to ask for again. A report built on stored queries can be run again, on a schedule, by anyone you share it with, and it gives the same answer the same data would give a person running the SQL by hand.
Klyrova is the second kind. Every section of a Klyrova report is drawn from a named dataset, and each dataset keeps the exact read-only query that produced its rows. Refreshing the report replays those queries against your database. The AI is used to build the report and to change it when you ask, not to produce each edition.
From a request to a report
You connect a database (PostgreSQL, SQL Server, Azure SQL Database or Microsoft Fabric) or upload a file, then describe the report in the chat window that sits on every Klyrova dashboard. The agent reads the schema, writes the queries, runs them and looks at the rows before it decides what goes on the page.
"A monthly operations report: orders and revenue by region for last month against the month before, late deliveries by carrier, and a table of every late order I can search."
Klyrova saved four datasets, each a read-only query with a name and a description, and wrote one report page from them: two figures with the change on the month, a bar chart of late deliveries by carrier, and a searchable table that reads every late order a page at a time. It added a date filter that defaults to last month, so every section follows it.
Each dataset is open to inspection. You can read its SQL, see when it last ran, which filters it follows and whether its last run failed, and export its rows. If a number looks wrong, you can see exactly where it came from, and ask for a fix in the same conversation.
Automated reports on a schedule
A report can refresh itself. Pick how often in the dashboard's settings: once a day on the Free plan, or as often as every five minutes on Pro and Teams. Scheduled refreshes run on Klyrova's servers with the report owner's connection, so the report is up to date when someone opens it, whether or not anyone was signed in when it ran. The latest rows are kept, encrypted, so the report opens on real data at once instead of waiting for every query.
Because the refresh replays SQL instead of asking a model, it costs no AI credits. A report that refreshes every hour for a year uses the same credits as the conversation that built it.
On Pro and Teams, a report's data model can also be imported into a fast copy inside Klyrova on a schedule you set (up to eight times a day, at the hours you choose, in your time zone). Reports built on the copy answer filters in milliseconds and stop putting load on your database between imports. See the semantic layer page for how models and imports work.
Filters that recalculate, not hide
Report filters are parameters of the queries themselves. When a reader picks a region or a date range, every dataset that follows that filter runs again with the chosen values bound by the database driver. Totals, averages and rankings are recalculated for the selection, which a filter applied to rows already on screen can't do. The report stays as it was saved: a reader's picks never overwrite the owner's version.
Export, share and publish
| What you want | How Klyrova does it |
|---|---|
| A PDF to send | Export as PDF captures the whole report on one page shaped like the dashboard, with its name, when the data is from and the filters applied. A team's report carries the team's logo. |
| The rows in a spreadsheet | Any section exports to Excel or CSV, either what it shows or, on Pro and Teams, every underlying row the query returns. |
| Colleagues who read it | Share as a viewer (look, filter, refresh) or an editor (change it through the chat). Nobody you share with sees your database password. |
| Readers outside your account | On Pro and Teams, publish the report as a public link or a private one that asks people to sign in, and embed it in your own site or app. |
Viewers can export only if the owner turns that on in the share dialog, and every export is recorded in the report's history: who, what, how many rows and in which format.
Changing a report
To change a report you ask for the change: "split revenue by channel as well", "make the table the first thing on the page", "show the trend as a weekly bar chart", "add a carrier filter". The agent edits the page and its datasets in place, checks that each changed query still runs, and you watch the report redraw. Nothing you didn't mention is rebuilt.
Reports you can trust with production data
Klyrova only reads. Every query passes a read-only check before it reaches your database: a single SELECT or WITH statement, nothing that writes or calls another server. On PostgreSQL each query also runs inside a read-only transaction that is rolled back. Connecting with a read-only database user adds a second lock. More on the security page.
Questions about AI reports
How is this different from asking a chatbot to summarise my data?
A chatbot summary is one answer at one moment. A Klyrova report stores the queries behind every section, so it can be refreshed, filtered, scheduled, shared and exported, and every number can be traced back to the SQL that produced it.
Do scheduled refreshes use AI credits?
No. Building and changing a report in the chat uses credits. Refreshing it, on a schedule or by hand, replays the stored queries without any AI model and costs nothing.
Can I export an AI report to PDF or Excel?
Yes. Export as PDF captures the whole report, and every section exports to Excel or CSV. Exporting every underlying row, beyond what a section shows, is included on Pro and Teams.
Which data can a report use?
PostgreSQL, Microsoft SQL Server, Azure SQL Database and Microsoft Fabric, CSV, Excel and JSON files you upload, which become tables you can query, and apps: Jira, Smartsheet and any JSON REST API.
Can I lay out a report by hand?
Yes, in the report builder: 26 visual types including tables, matrices and maps, several pages, filters and drill, with the agent beside you.
Can people outside my company see a report?
On Pro and Teams you can publish a report as a public link, or as a private link that only people you've shared it with can open after signing in, and embed either one in another site.
Updated 14 November 2026