






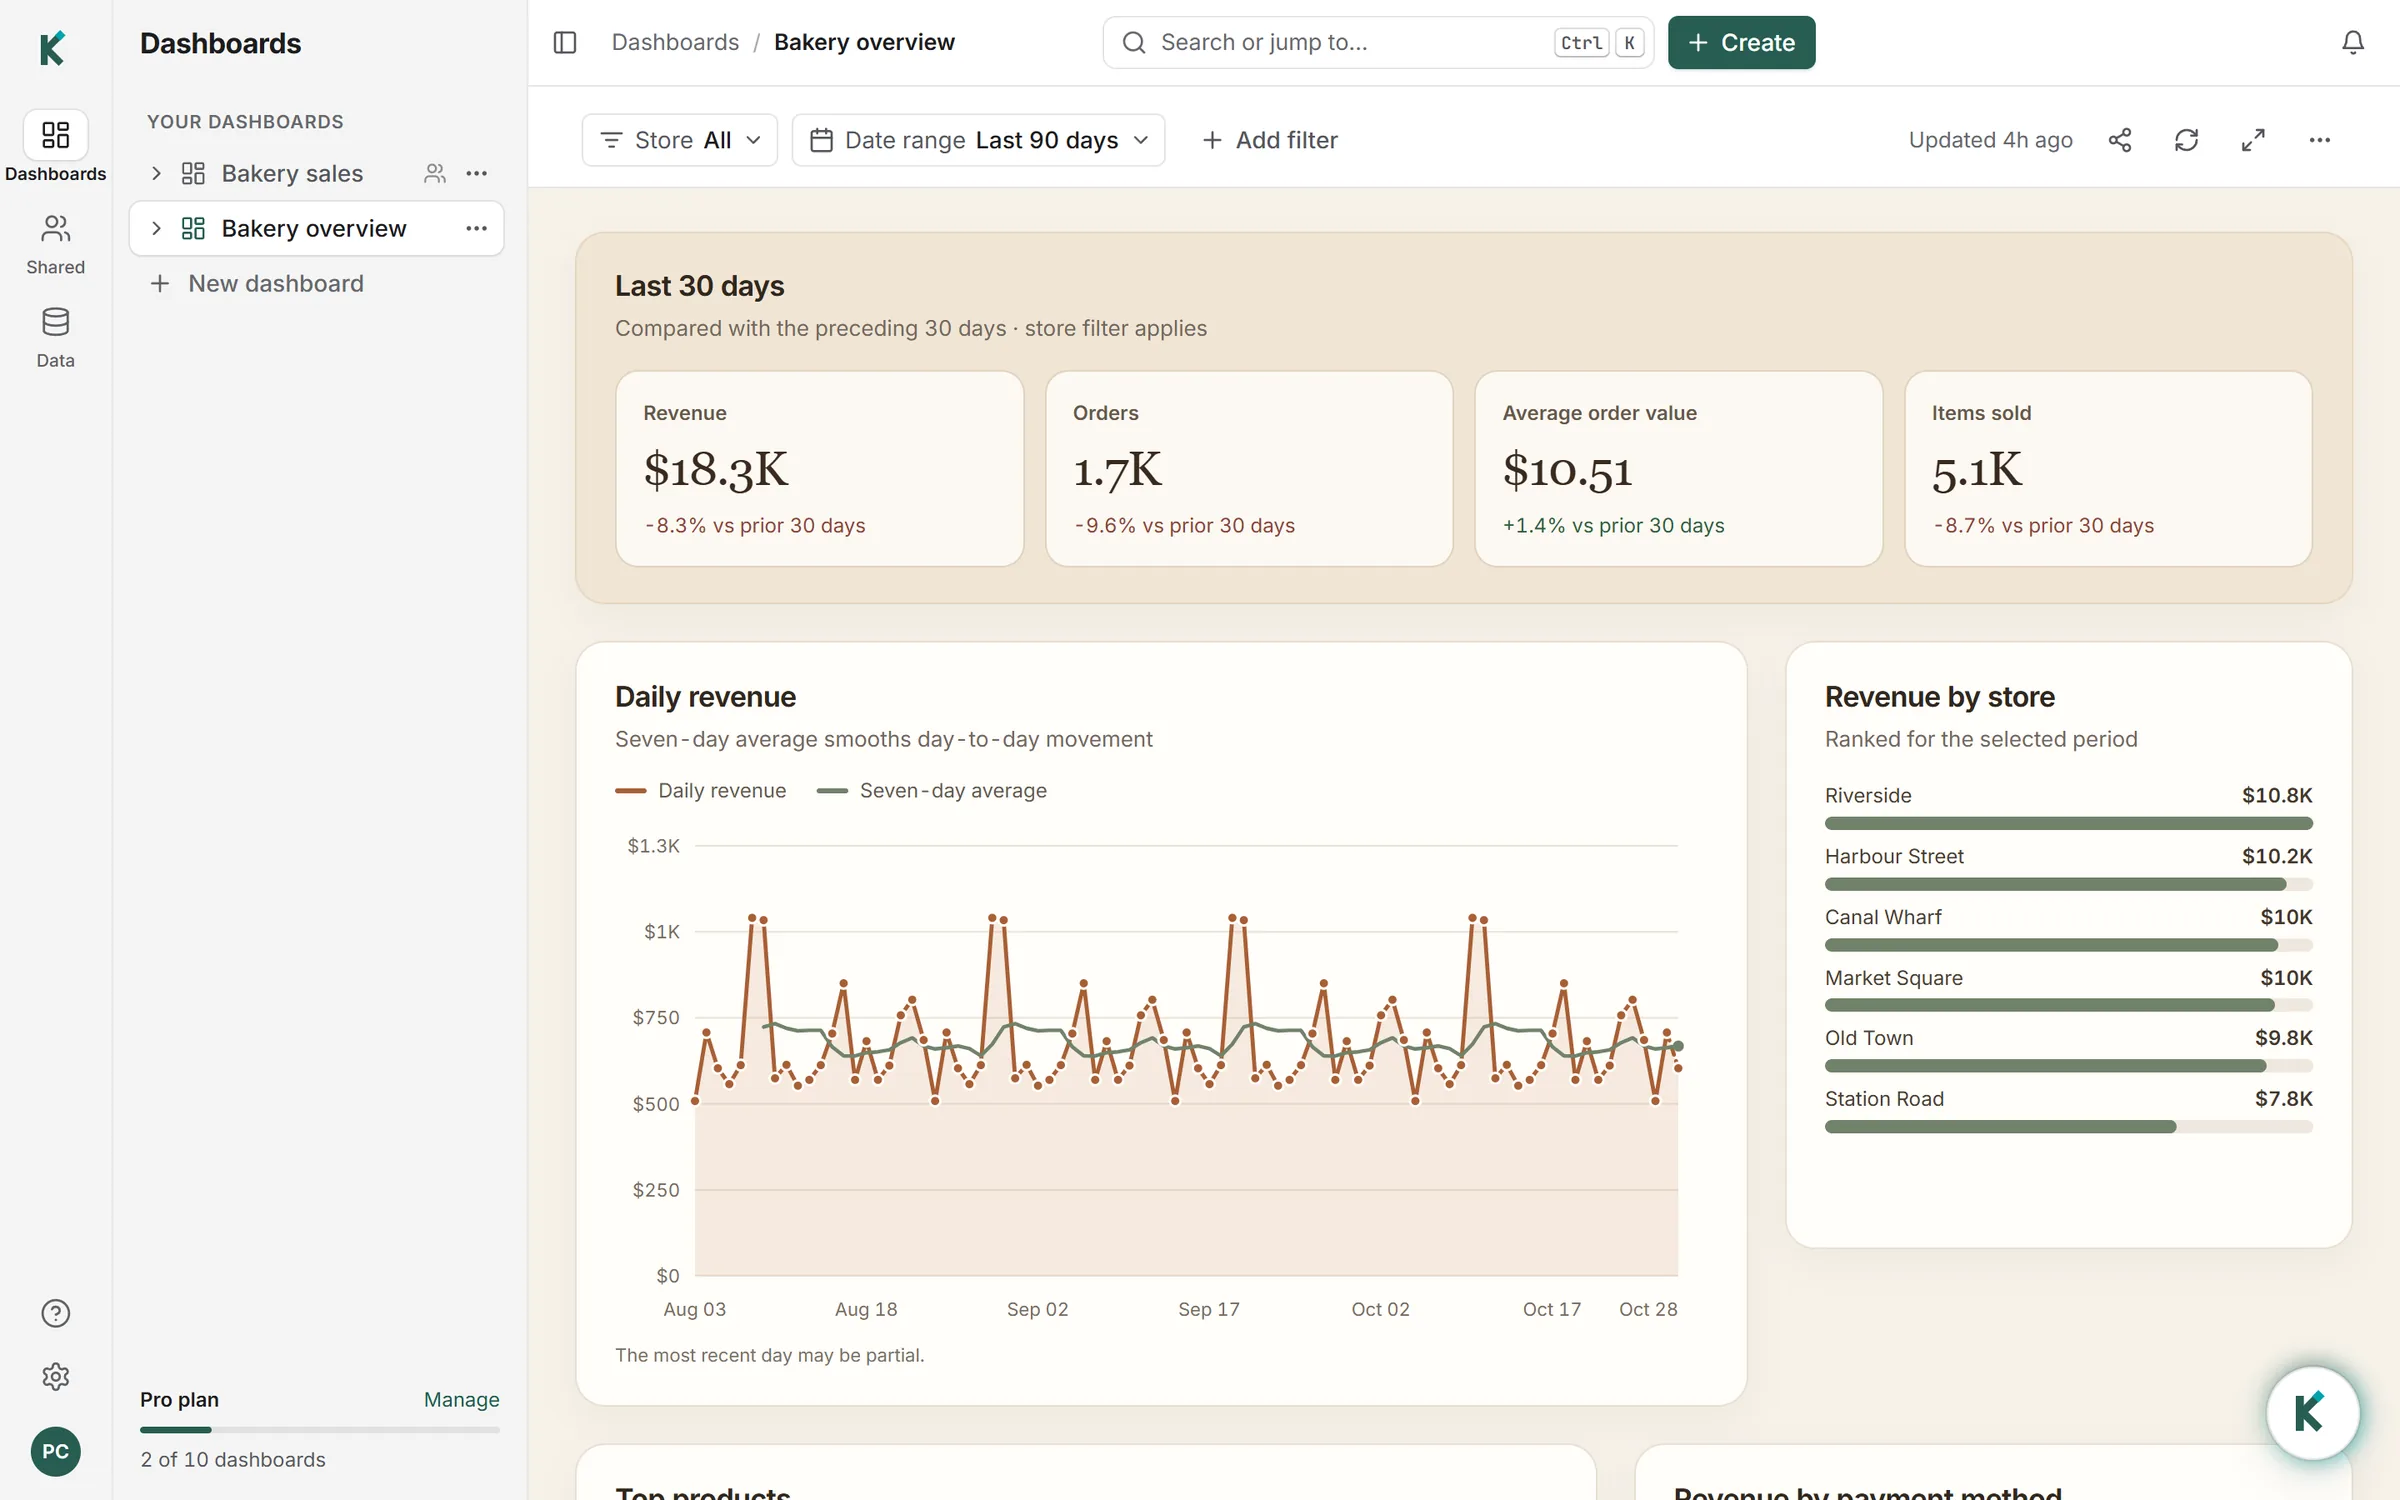
The difference in one paragraph
Power BI is Microsoft's business intelligence platform: you shape the data, model it and design each report yourself, usually in Power BI Desktop, then publish to the Power BI service. Klyrova is an AI dashboard tool: you connect a database, say what you want to see, and its agent finds the tables, writes read-only SQL, checks the results and lays out the page. Both give you dashboards that refresh from your data. The difference is who does the building.
How building a report differs
In Power BI, a typical report means getting data in with Power Query, defining relationships and measures in DAX, then placing visuals on a canvas and formatting each one. It's powerful and precise, and it takes skill and time.
In Klyrova, you pick the tables your dashboard builds on (Klyrova suggests them from your foreign keys and draws the relationships), then ask:
"Revenue and margin by region for this quarter against last, a monthly trend, and the twenty largest customers with their last order date. Add a region filter."
The agent writes a dataset for each part, tests every query at the filter's default, and draws one dashboard page. "Put the customers table first" or "show the trend as weekly bars" is one more message, not another hour in the designer.
You can read every query the agent wrote. A dashboard Klyrova builds is a page the agent designs for your data, and you change it by asking. When you'd rather place every visual yourself, the report builder gives you a drag-and-drop canvas on the same data model.
Side by side
| Power BI | Klyrova | |
|---|---|---|
| How reports are built | By you, in Power BI Desktop (a Windows application) or the web editor | By an AI agent from your request, or by you in the report builder (beta), in the browser on any computer |
| Query language you work in | Power Query (M) to shape data, DAX for measures | None required; the agent writes SQL, which you can read and ask to change, and measures can be written as Excel-like formulas |
| Data model | Semantic models with tables, relationships and DAX measures | A data model of tables, measures and relationships (one-to-many, one-to-one or many-to-many, filtering one or both ways), with a diagram you can connect tables on |
| Storage | Import, DirectQuery, and composite models | Live (queries your database) or imported into a fast copy |
| Scheduled refresh | Set times per semantic model | Live dashboards every 5 minutes to daily; imported models up to 8 set times a day in your time zone |
| Changing a report | Edit visuals and formatting by hand | Ask for the change in plain words, or edit it by hand in the report builder (beta) |
| Data sources | Hundreds of connectors | PostgreSQL, SQL Server, Azure SQL, Microsoft Fabric, uploaded CSV, Excel and JSON, and apps: Jira, Smartsheet and any JSON REST API |
| Sharing and embedding | Workspaces and apps; embedding through Power BI Embedded or publish to web | Viewers and editors; public or private embed links on Pro |
| Licensing | Per-user licences in most set-ups, or capacity | Free plan; Pro $18 a month; Teams $28 a person a month |
Familiar where it counts
A dashboard is built on a data model: views over your tables, measures written once and reused, and relationships so a filter on one table narrows the tables related to it. Like a Power BI semantic model, it can be imported: Klyrova copies the model's views into a fast copy on a schedule you set, every day or on chosen weekdays, at up to eight times a day, in your own time zone, with an email if an import fails. If you've set up a scheduled refresh in Power BI, the settings will look familiar. Dashboards on an imported model answer filters in milliseconds and stop putting load on your database during the day.
Dashboards on a live model refresh by replaying their stored queries, as often as every five minutes on Pro. No AI model is involved in a refresh, so it costs no credits and gives the same answer the same data would.
When Klyrova is the better choice
- You need answers this week, not a BI project. A first dashboard takes minutes of conversation.
- Nobody on the team writes DAX. The agent does the SQL; you describe the business question.
- Your data lives in PostgreSQL or SQL Server and you want dashboards straight on it, refreshing on a schedule.
- You work on a Mac or a Chromebook. Klyrova runs entirely in the browser.
- You want dashboards inside your own product. Publish a dashboard and paste one iframe; see embedded analytics.
- You want a branded app for your organisation or clients, with your address, logo and colours, on the Teams plan.
When Power BI is the better choice
- You need connectors Klyrova doesn't have. Power BI reaches far more sources, from SharePoint lists to SaaS applications; Klyrova connects to the four database types above and uploaded files.
- You need one query across several databases. A Klyrova dashboard can show charts from different databases side by side, but each query reads one source.
- You have a large, governed BI estate: certified datasets, row-level security, deployment pipelines and hundreds of curated reports. Power BI's governance is mature, and Klyrova doesn't try to replace it.
- You need pixel-precise control over every visual, or a specific custom visual from its large library.
- Your organisation lives in Microsoft 365 and wants reports in Teams, Excel and PowerPoint.
Using both
Klyrova connects to Microsoft Fabric warehouses, lakehouse SQL endpoints, SQL databases, mirrored databases and KQL databases through your Microsoft sign-in, and to Azure SQL and SQL Server. So it can sit beside an existing Fabric and Power BI estate: the curated reports stay in Power BI, and the one-off questions and fast dashboards that would otherwise wait in the BI team's queue get answered in Klyrova, on the same data, with read-only queries.
Questions about Klyrova and Power BI
Is Klyrova a replacement for Power BI?
For teams that want dashboards on their SQL databases without learning a BI tool, often yes. For large organisations with governed Power BI estates, Klyrova works best alongside it, for questions the curated reports don't answer yet.
Do I need to know DAX or SQL to use Klyrova?
No. You describe what you want and the AI agent writes the SQL. Every query is visible if you want to check it, and you can ask for changes in plain words.
Can Klyrova use my Microsoft Fabric or Azure SQL data?
Yes. Fabric warehouses, lakehouse SQL endpoints, SQL databases, mirrored databases and KQL databases connect through your Microsoft sign-in, and Azure SQL Database and SQL Server connect with a login. Every query is read-only.
Does Klyrova have scheduled refresh like Power BI?
Yes. Live dashboards refresh on a schedule, as often as every five minutes on Pro. Imported data models refresh at up to eight times a day that you choose, on chosen weekdays, in your time zone.
How much does Klyrova cost compared with Power BI?
Klyrova has a free plan, Pro at $18 a month and Teams at $28 a person a month, with the AI included as credits. Viewing a shared dashboard needs only a free Klyrova account. See pricing.
Updated 14 November 2026