






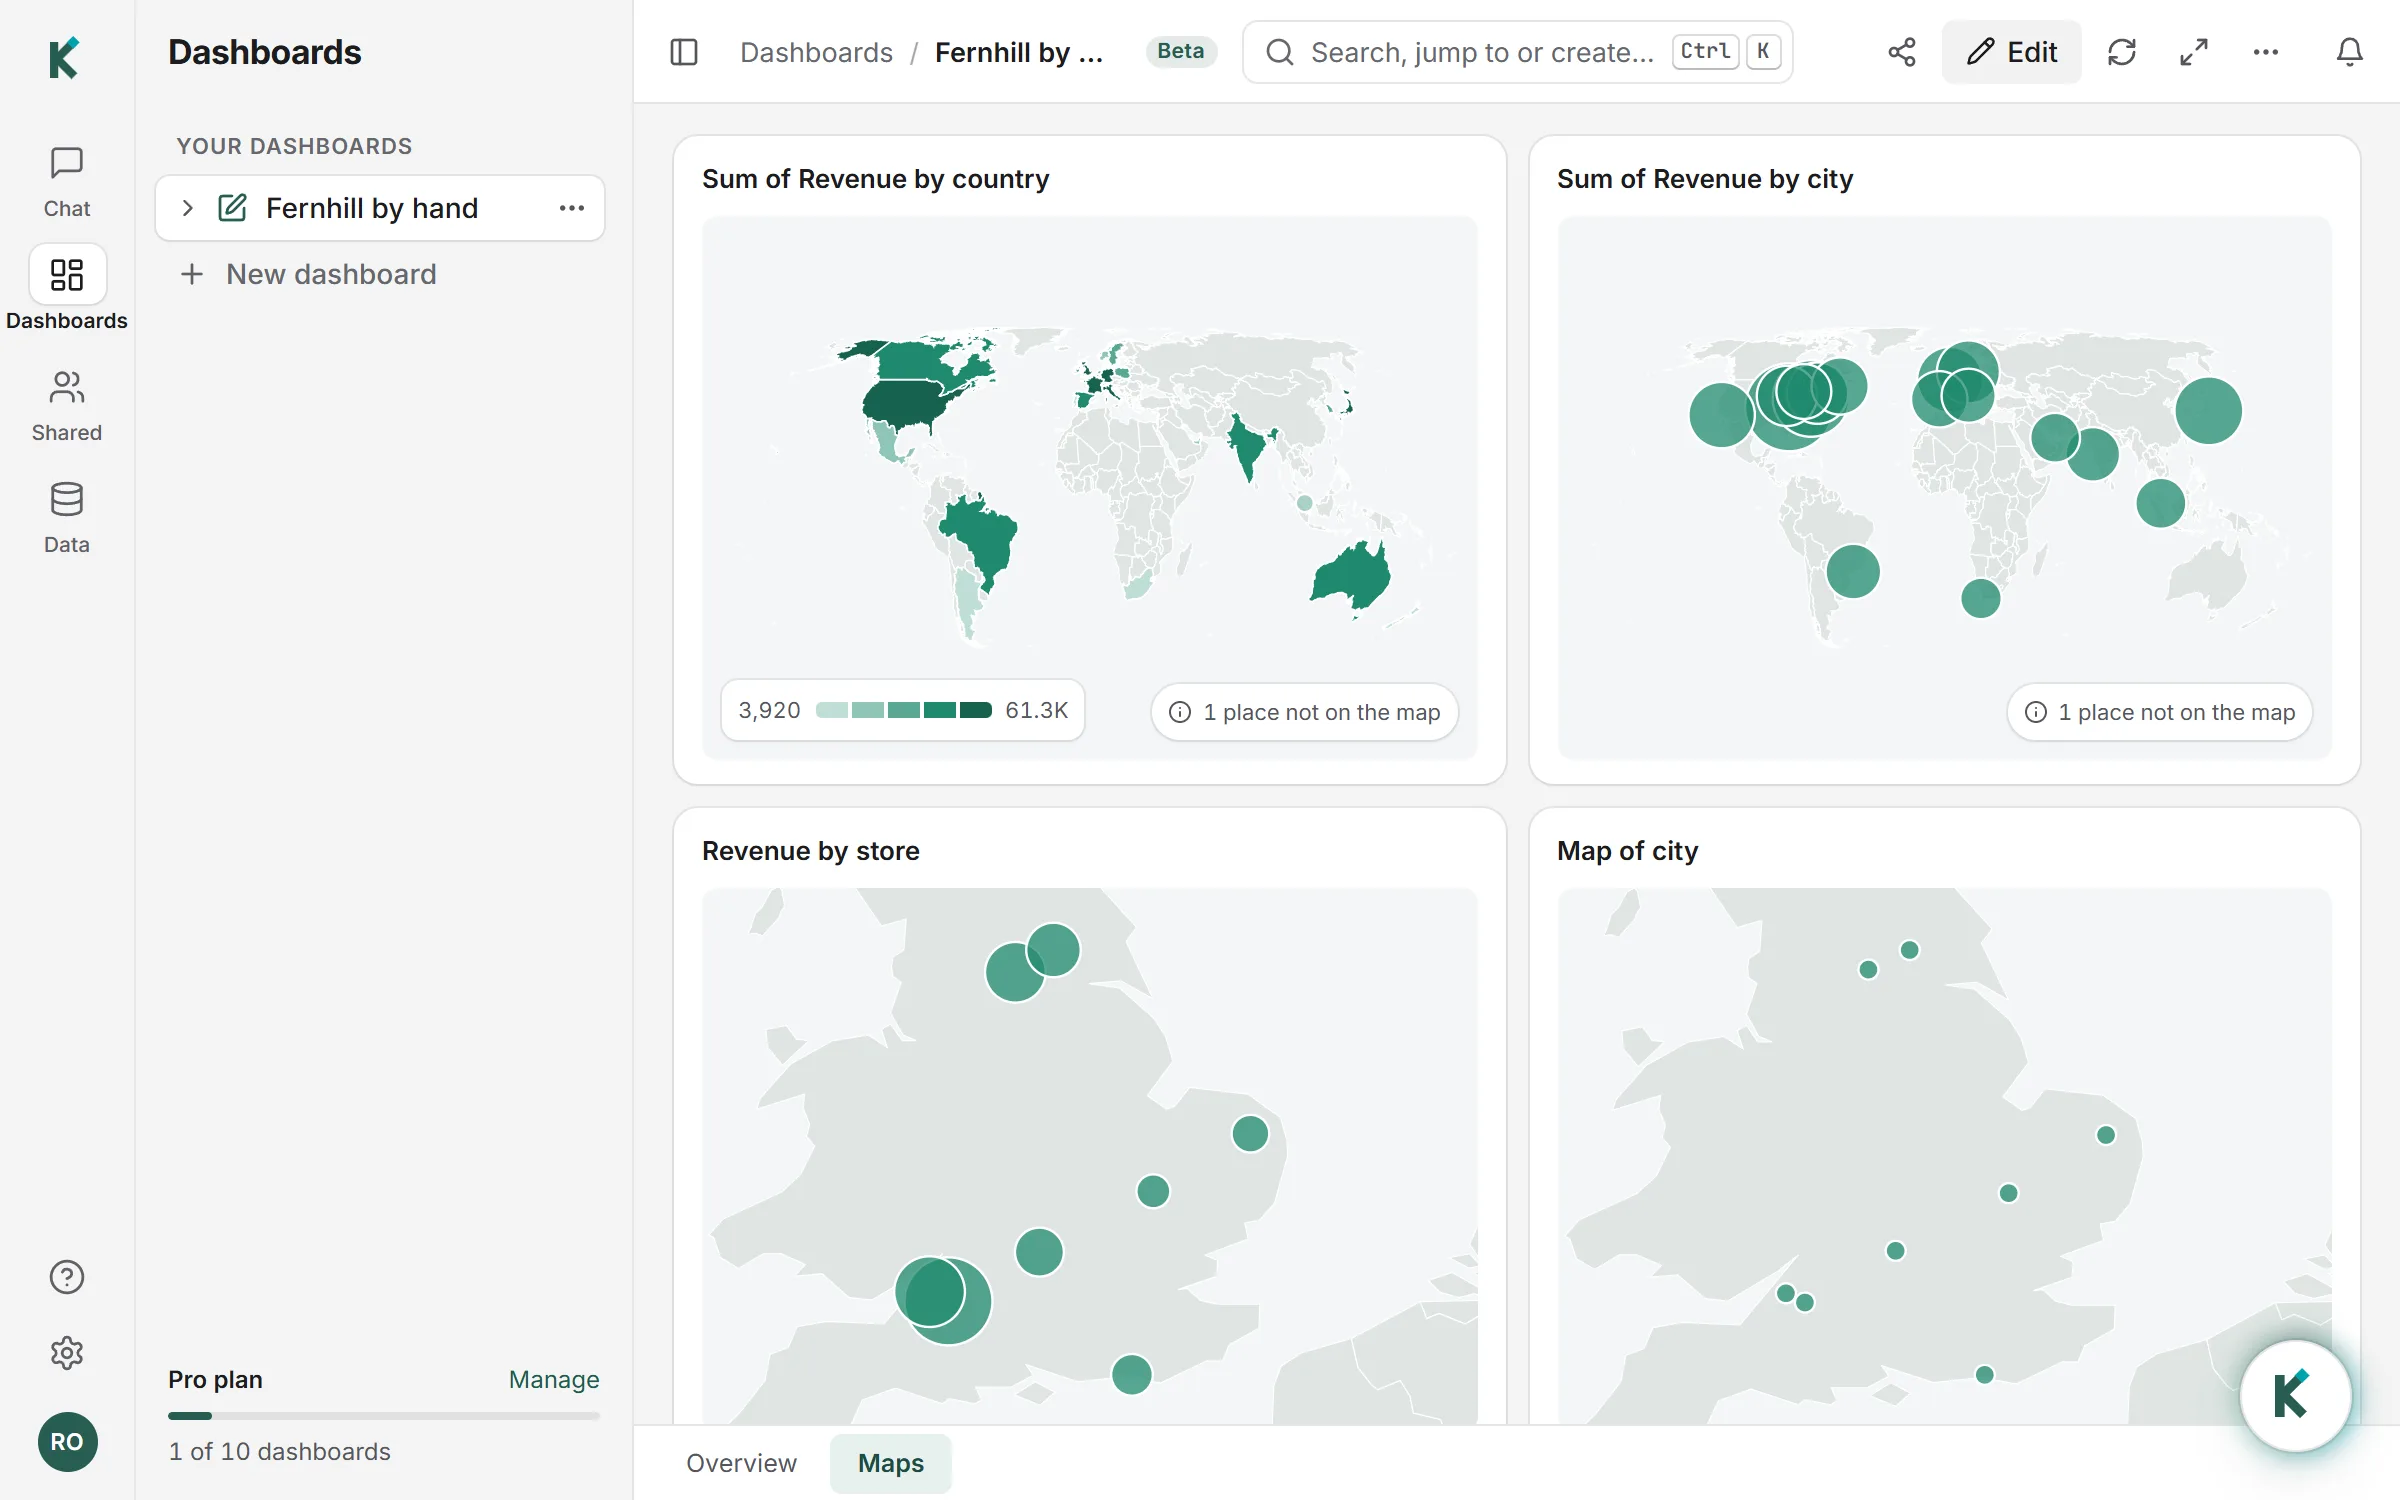
What a map dashboard is
A map dashboard shows where things happen: sales by country, customers by state, stores by city, deliveries by coordinates. Maps answer "where" questions that bar charts make you read label by label. The two common kinds are a filled map (also called a choropleth), where each region is shaded by its value, and a bubble map, where each point is a circle sized by its value.
Klyrova draws both, and decides which from your data: a column of countries or states is filled; a column of cities, or rows with a latitude and a longitude, become bubbles.
What it understands
- Countries, by the names and codes people write: "United Kingdom", "UK", "GB", "GBR", "United States of America", "USA".
- States and provinces of the United States, Canada, Australia and India, by name or code ("California", "CA", "Calif.").
- About 7,300 cities and towns worldwide, including "City, Country" or "City, State" to pick the right Paris or Portland. When a city's name is shared, Klyrova picks the one in the country your other cities are in.
- Latitude and longitude, for anything else: shops, sites, postcodes or delivery points. Each place is averaged to one point, so many orders at one shop draw one bubble.
A column is read as one kind of place, whichever kind most of its values are, so "CA, TX, NY" are states while "CA, FR, DE" are countries. Places Klyrova can't find are counted on the map ("3 places not on the map"), never guessed.
How it looks
Filled maps use five shades of one colour, spread by rank so one huge figure doesn't leave every other region pale, with a scale in the corner. Bubbles are sized by area, which is how the eye compares them. The map fits the places it shows: a set of UK cities draws the UK, a worldwide list draws the world. Zoom with + and −, drag to move, and point at a place to read its figure and any extra values from the tooltip.
Built by hand or by asking
In the report builder, add a Map and drop a place column into Location, a number into Size, and, if you have them, the latitude and longitude columns into their own slots (Klyrova recognises columns named latitude, lat, longitude, lng or long). Or ask the agent: "show revenue by country on a map" or "turn this bar chart into a map of states".
Private by design
Klyrova draws the map itself, from public-domain map data (Natural Earth) shipped with the app. No map service is asked for tiles or locations, so the names and numbers in your report never leave Klyrova to draw it.
Questions about map dashboards
Can I map postcodes or street addresses?
Not by name. Add a latitude and a longitude for each place, from your database or a file, and Klyrova places them exactly.
Which countries' states can be filled?
The states and provinces of the United States, Canada, Australia and India. Every country in the world can be filled.
What happens to places it doesn't recognise?
They are left off the map and counted in its corner, with their names in the tooltip, so you can fix the spelling or add coordinates.
Does a click on the map filter the report?
Yes. A click on a country, state or bubble filters the other visuals on the page, like a click on a bar.
Do maps send my data to a mapping service?
No. The map is drawn in your browser from map data that ships with Klyrova.
Updated 14 November 2026