






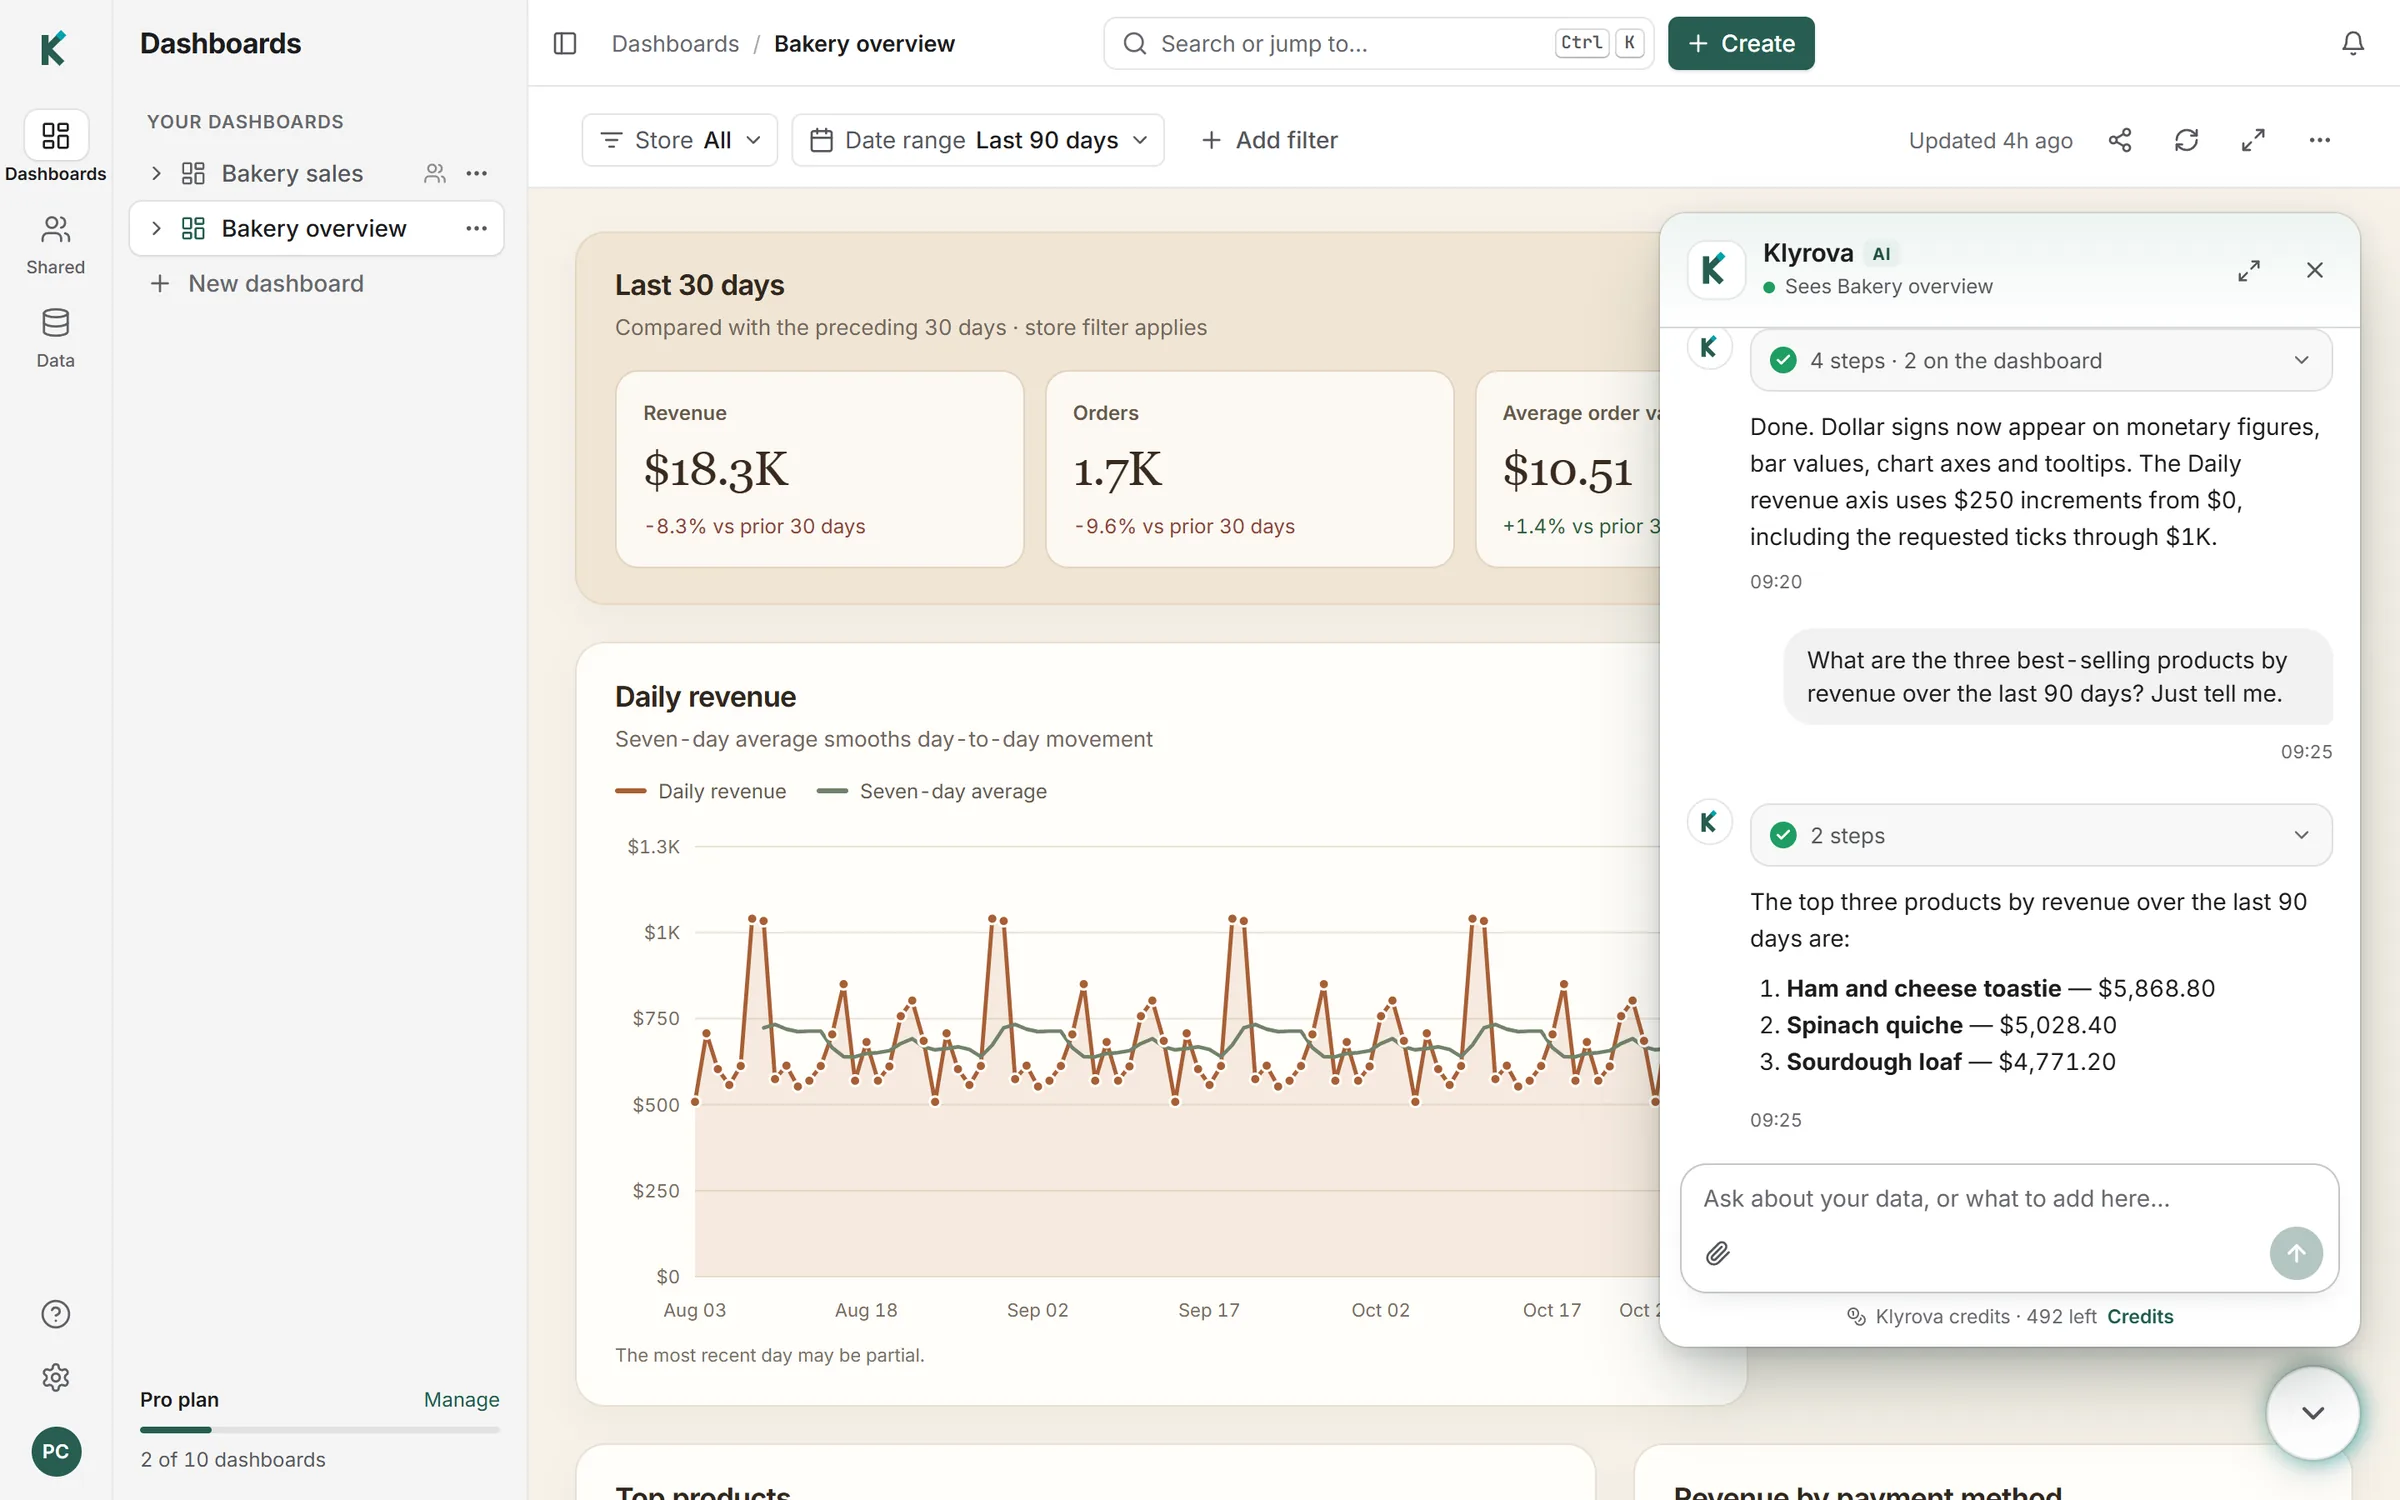
In short, to build an AI dashboard you connect a data source, tell the AI agent what you want to see in plain language, and keep the page it builds. In Klyrova the agent writes read-only SQL for every chart and table, checks the rows, and lays out the page; after that the dashboard refreshes by replaying those stored queries, with no AI involved. Here is each step in detail.
Step 1: Create an account
Go to klyrova.app and choose Start free, or continue with Google or Microsoft. A confirmation email proves your address. Every account starts with 500 Klyrova credits, which is what chats are paid with. You don't need an AI provider key: Klyrova runs the AI.
Step 2: Connect your data
Open Data in the rail on the left, then Data sources and Add source (or type "add a data source" in the search at the top). You have three kinds of data to choose from:
- A data source: PostgreSQL, SQL Server, Azure SQL Database or Microsoft Fabric. Enter the host, database and a login, press Test, then Add & connect. Use a login that can only read; our read-only user guide has the SQL for each database.
- An app: Jira (sign in with Atlassian), Smartsheet or any REST API. Its tables are picked like a database's, and the dashboard reads them live or imports them, as for a database.
- A bucket of files: upload CSV, Excel or JSON and each file, or each sheet, becomes a typed table you can query. A CSV can be up to 500 MB. See CSV to dashboard for what Klyrova does with your columns.
The Free plan includes one data source (a database or an app) and one bucket of 100 MB, enough to try everything in this guide.
Step 3: Create the dashboard
Open Dashboards in the rail, then New dashboard (or type "new dashboard" in the search at the top). The dialog first asks how to build it: Ask Klyrova, which this guide follows, or Build it myself, which opens the report builder on the same data. Then come a few short steps.
Name and data
Give the dashboard a name, then choose what it builds on: your data, where you tick one or more of your sources and buckets, or an existing data model, yours or one your team shares, which skips straight to the last step.
Tables
Klyrova opens each source you picked and pre-ticks the tables it would use. It starts from the table with the most foreign keys and adds what that table reaches, so an orders table brings its customers, products and stores with it. Plumbing such as migration and log tables is left out. Change the selection freely; at least one table is needed.
The foreign keys between ticked tables become the data model's relationships, so the agent knows how orders join to customers before it writes a line of SQL. If you picked tables from two different databases, their charts sit side by side rather than joined.
Live or import
Live means every chart and filter queries your database each time: always current, as fast as your database is. Import, on Pro and Teams for SQL Server, Azure SQL and PostgreSQL sources (tables from a bucket stay live), copies the picked tables into a fast store kept by Klyrova on a schedule you set, up to eight times a day. The dialog estimates how many rows each import reads and how long it takes before you choose.
What to see
Describe the dashboard. A few suggestions are there to start from, such as "An overview: the three numbers that matter most, a monthly trend and a top 10". The more specific you are about the questions, the time range and who will read it, the closer the first version will be. For example:
Revenue by store and by month for the last 90 days, the top 10 products by margin, a table of every order I can search, and a date filter. It's for the weekly operations meeting.
Choose Create and build.
Step 4: Watch the agent build it
The dashboard opens with its chat window sending your request. You see the agent's reply as it writes, and a line saying what it is doing: reading the schema, running a query, writing the page. While it writes the page, the layout appears first and each section draws as soon as its part is finished.
Behind each section is a dataset: a named, read-only query the agent tested before keeping it. Building a dashboard uses credits; how many depends on how much work the agent does.
Step 5: Change it by asking
A Klyrova dashboard isn't edited by dragging boxes. You ask for the change in the chat, and the agent edits the page and its datasets:
- "Put the orders table at the top and the two charts side by side."
- "Show revenue as a weekly bar chart and mark the current week as in progress."
- "Use our brand colours, dark green and sand."
- "Add the average order value next to total revenue."
Use Focus in the toolbar to see the dashboard full screen, without the app around it.
Step 6: Add filters
From the dashboard's ⋯ menu, choose Add a filter and describe it: "a store filter, several stores at once, all stores by default" or "a date range defaulting to the last 30 days". The agent adds it to the filter bar and wires it into every dataset it should reach. Filters are query parameters, so a pick recalculates totals in the database rather than hiding rows, and picking a filter costs no credits.
Step 7: Set how it refreshes
Open ⋯ → Dashboard settings and go to Refresh.
| Mode | What you set | Plans |
|---|---|---|
| Live | Auto-refresh: every 5, 15 or 30 minutes, every hour, every 3 hours or every day, or off (refresh by hand). | Every day on Free; down to every 5 minutes on Pro and Teams. |
| Imported | An import schedule: daily or chosen weekdays, up to eight times a day, in your time zone, with an email if an import fails. | Pro and Teams. |
Either way, refreshing replays the stored queries without the AI, so it costs no credits, and it runs while nobody is signed in. On an imported dashboard, Refresh pressed by the data model's owner starts a new import.
Step 8: Check the numbers
Open ⋯ → Datasets to see what the page is drawn from. Each dataset shows its SQL, how many rows it returned, when it last ran, which filters it follows and its last error, if any. If a number looks wrong, read the query, then ask the agent to change it in words: "revenue should exclude refunded orders".
Step 9: Share, publish and export
- Share from the toolbar with viewers, who look and refresh, or editors, who can also ask the agent to change the page. People without an account are invited to create a free one.
- Publish and embed (Pro and Teams) gives a public link, or a private one that asks people to sign in, plus the code to embed the dashboard in another site or app.
- Export as PDF saves the whole page, with your team's logo if you are on Teams.
- Hover over a section and use its own ⋯ to export its rows to Excel or CSV.
Tips for a better first dashboard
- Name the decision, not just the data. "What should we restock this week" gets a more useful page than "show me inventory".
- Say the time range. The agent picks a sensible default, but "the last 90 days" removes the guess.
- Say who reads it. An operations team wants dense tables; a board wants three numbers and a trend.
- Start small, then ask for more. Changes are cheaper than a rebuild, and each one is checked against your real data.
Questions about building an AI dashboard
Do I need to know SQL?
No. You describe what you want and the agent writes the SQL. You can read every query it wrote under Datasets.
How long does it take to build an AI dashboard?
Connecting a source takes a minute or two. The agent usually builds a first page in one to three minutes, depending on how many queries it needs and how fast your database answers.
Can I build a dashboard from a CSV or Excel file?
Yes. Upload it to a bucket and each file or sheet becomes a table, then create a dashboard on it like any database.
Does a scheduled refresh cost credits?
No. Refreshes, filter picks and exports replay the stored queries without AI. Only building and changing the dashboard in the chat uses credits.
Can I move charts around myself?
You change the layout by asking the agent, which keeps the page consistent. Tell it what to move, resize or restyle and it edits the page.
Updated 16 November 2026