






The short version
Choose Tableau if you have analysts who want fine control over every mark, a large catalogue of connectors, or an organisation already standardised on it. Choose Klyrova if you want people who don't use BI tools every day to get live dashboards and answers from SQL data, spreadsheets, Jira or Smartsheet in minutes, in the browser, without per-user licences for creators.
Side by side
As we understand each product in November 2026; check Tableau's own site for its latest features and prices.
| Tableau | Klyrova | |
|---|---|---|
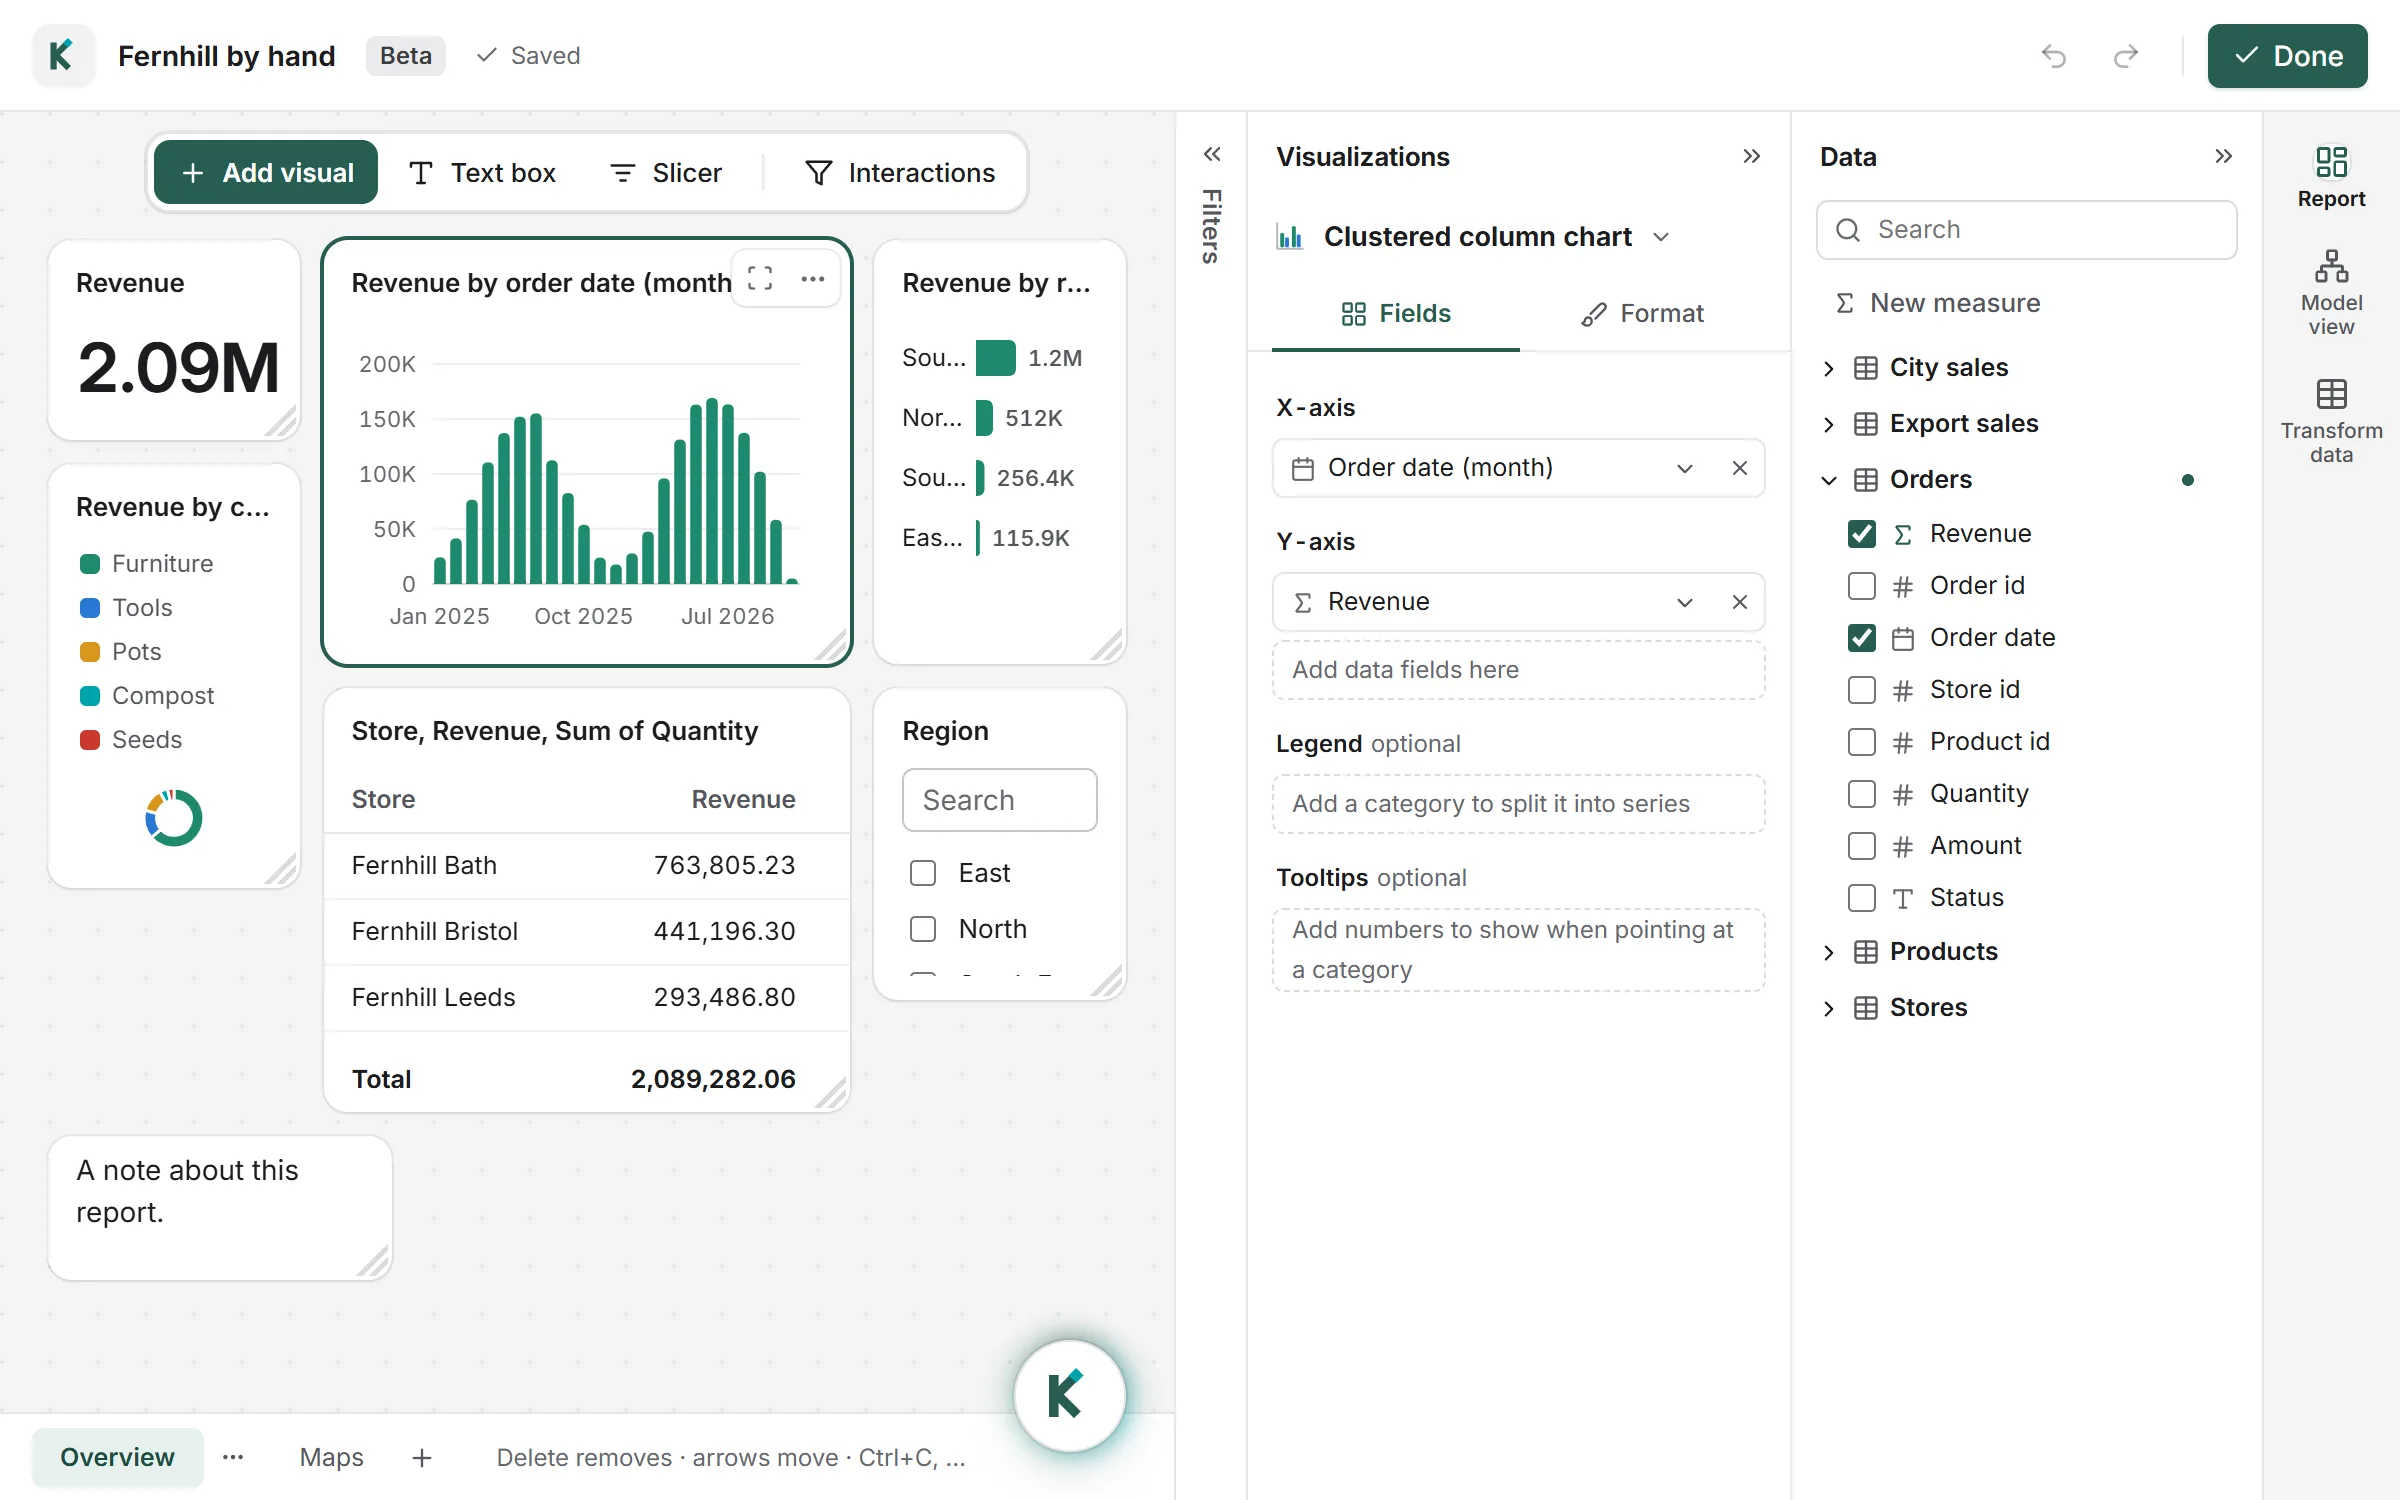
| How dashboards are built | By dragging fields onto shelves in Tableau Desktop or the web editor | By an AI agent from a request in plain words, or by hand in the report builder (beta) |
| Learning curve | Rewarding but steep for advanced work | Describe what you want; build by hand when you prefer |
| Data preparation | Tableau Prep, a separate tool | Transform data steps inside the same app, run as SQL in your database |
| Data sources | A very large catalogue of connectors | PostgreSQL, SQL Server, Azure SQL, Microsoft Fabric, CSV, Excel and JSON files, Jira, Smartsheet and any REST API |
| Live or extracted | Live connections or extracts | Live queries, or an imported copy on a schedule of up to eight times a day (Pro and Teams) |
| Asking questions in words | AI features in its newer editions | The core of the product: a chat that queries your data and builds or changes dashboards |
| Maps | Rich built-in maps | Filled maps of countries and states, and bubbles for cities and coordinates |
| Embedding | Embedded analytics offerings | Public or private embed links on Pro and Teams |
| Price | Per-user licences by role | Free plan; Pro $18 a month; Teams $28 a person a month |
Where Klyrova is different
- Ask, don't drag. "Revenue by region on a map, the weekly trend under it, and a table of overdue invoices" is a request, not an afternoon. Change it the same way: "put the table first".
- No AI in the refresh. Each chart replays the SQL the agent wrote. The AI isn't asked again, so numbers can't drift.
- Read-only by contract. A guard refuses anything but a single SELECT or WITH before it reaches your database.
- Apps as data. Jira, Smartsheet and any JSON REST API become tables you can query and chart, read live or imported like a database's.
Where Tableau is stronger
- Fine-grained visual control and a huge range of chart types and interactions.
- Hundreds of connectors and long experience in large enterprises.
- A large community, training and certification ecosystem.
Questions about Klyrova and Tableau
Can Klyrova open Tableau workbooks?
No. Klyrova connects to your data directly; ask it to build the dashboard you had, or build it in the report builder.
Is Klyrova cheaper than Tableau?
Klyrova has a free plan, Pro at $18 a month and Teams at $28 a person a month. Compare with Tableau's current prices for your roles.
Do I need Tableau Prep-style tools with Klyrova?
No separate tool: Transform data is built in, and its steps run as SQL in your database.
Does Klyrova work on a Mac?
Yes. Klyrova runs in the browser on any computer, with nothing to install.
Updated 16 November 2026