






What embedded analytics means here
Embedded analytics is reporting that lives inside another product: the charts and tables your users need, shown in your app instead of in a separate BI tool they have to open. Building it yourself means queries, charting, caching, permissions and refresh jobs; embedding it means pasting a snippet.
With Klyrova, the dashboard you embed is the same one you built by asking for it: an AI agent wrote the read-only SQL against your database and drew the page, and the dashboard refreshes by replaying those queries. Publishing gives it a link and an embed code. You can build the dashboard first and embed it in the same afternoon.
How to embed a dashboard
- Build the dashboard in Klyrova from your PostgreSQL, SQL Server, Azure SQL or Microsoft Fabric data, or from uploaded files.
- Open Publish and embed from the dashboard's menu and choose a public link, a private link, or both.
- Paste the embed code into your page. It's an ordinary iframe:
<iframe title="Sales overview"
                src="https://klyrova.app/embed/…"
                width="100%" height="720"
                style="border:0;display:block"
                allow="fullscreen" loading="lazy"></iframe>
The frame shows the dashboard with a slim bar above it: the dashboard's name, its filters if you allow them, when the data was last updated, a full-screen button and a small Klyrova mark. It works in any page that can hold an iframe, from a React or Angular app to a CMS page or an internal wiki.
Public or private
| Public link | Private link | |
|---|---|---|
| Who can see it | Anyone who has the link or the page it's embedded in | Only you and the people the dashboard is shared with |
| Sign-in | None | A Klyrova sign-in window opens from the frame; the viewer signs in as usual and confirms before the report appears |
| Filters | Off unless you switch them on for that report | On, like the dashboard |
| Refresh | Rows follow the dashboard's schedule and your own refreshes; visitors can't trigger queries | Viewers can refresh |
| Someone else gets the link | They can see the report | They're told they have no access, without the report's name |
Each dashboard has at most one public and one private link. New link replaces it and the old one stops working at once; Unpublish takes it down. Each card shows how many times the link has been opened and when it was last opened.
What visitors can and can't see
A published dashboard sends the page and each dataset's saved rows, nothing more. Visitors never receive the SQL behind the charts, which data sources it reads, the names in your data model, or who owns the report. If a query fails, a public visitor sees a plain message, never the database's own error text, which can name servers and logins.
When you allow filters on a public report, a visitor's pick runs the dashboard's queries with the new values bound as parameters, through the same read-only path as everything else in Klyrova, with rate limits per visitor and per report so one busy embed can't flood your database. With filters off, public visitors never cause a query at all: they see the rows from the dashboard's latest scheduled or manual refresh.
A link can open already filtered: add ?f.<filter>=<value> to the frame's address, the same way a dashboard link does, to show a single region or customer by default.
Private reports inside other sites
A frame on another site can't see a Klyrova session in the same browser, and Google refuses to sign anyone in inside a frame. So a private report opens a small Klyrova window for the sign-in instead. The person signs in as they normally would, presses Continue to show the report as themselves, and the frame picks up a short-lived embed pass that only works for embedded reports, never for the Klyrova app itself. The pass is handed only to the frame that asked for it, once, and the sign-in survives a reload.
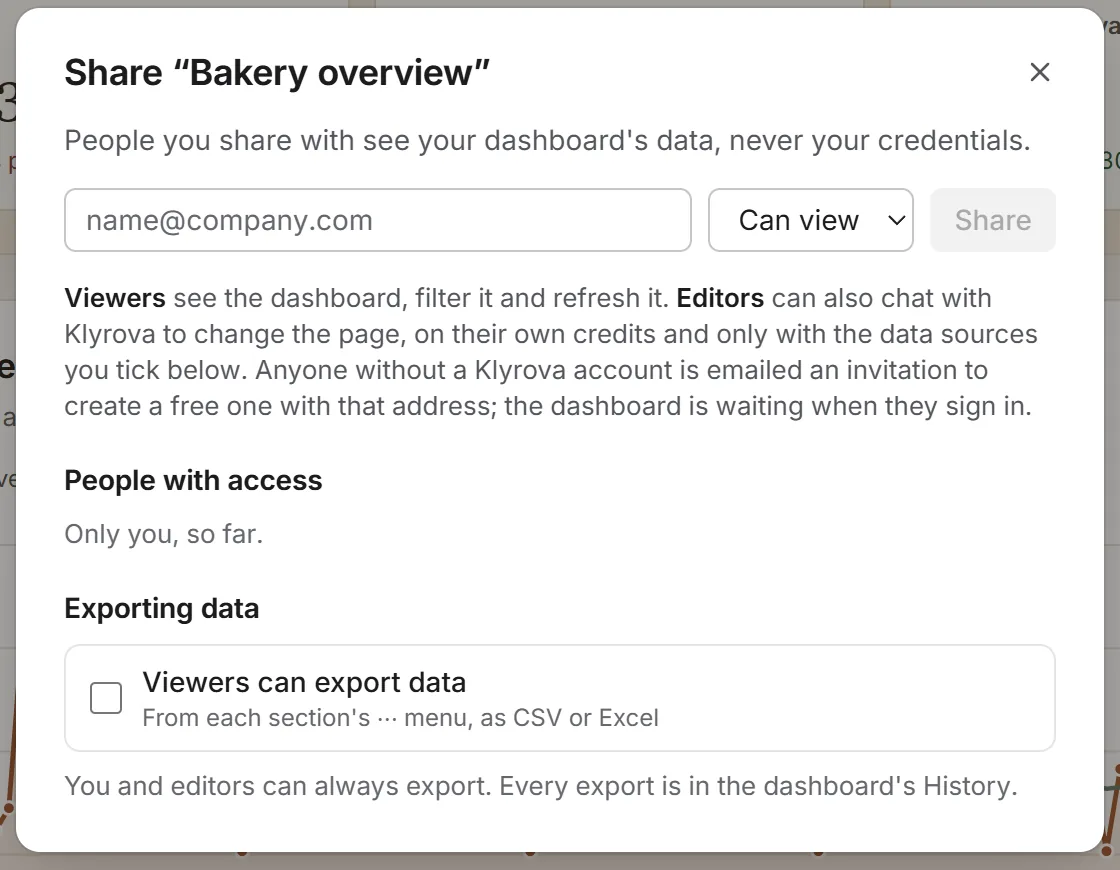
Access is exactly the dashboard's sharing: the owner, plus the people it's shared with as viewers or editors. To give a new client access, share the dashboard with their email address.
Embedding on a white-label portal
On the Teams plan, your organisation has its own branded portal at yourteam.klyrova.app, and everything people sign in to there carries your logo and colours. Published embeds keep the same small Klyrova mark wherever they appear. See white-label AI dashboards.
What to know before you embed
- Publishing is part of the Pro and Teams plans. If the dashboard owner's plan stops including it, the links pause and show that they're paused; they come back when publishing is back on the plan.
- A dashboard needs a page before it can be published, so build it first.
- Tables inside an embedded dashboard page through the rows the dashboard has saved (up to 5,000 per dataset). Paging through millions of rows and exporting data are for people signed in to Klyrova.
- The read-only rules don't change: every query an embed can cause is a single checked SELECT. More on the security page.
Questions about embedded analytics
How do I embed a dashboard in my web app?
Publish the dashboard from its menu (Publish and embed), copy the embed code, and paste the iframe into your page. Public links show the report to anyone; private links ask the viewer to sign in and check they have access.
Can people see my SQL or my database details in an embedded dashboard?
No. An embed receives the page and the saved rows only. The queries, the data sources, the data model's definitions and the owner are never sent, and errors are shown in plain words without database details.
Can viewers filter an embedded report?
On a private report, yes. On a public report, only if you switch filters on for that report; they're off by default. A link can also open with a filter already set.
Does the embedded dashboard stay up to date?
Yes. A public report shows the rows from the dashboard's latest refresh, scheduled or by hand, and reloads them at the dashboard's cadence. Private viewers can also refresh it themselves.
Which plan do I need to embed dashboards?
Pro ($18 a month) or Teams ($28 a person a month). Both include public and private links; Teams adds your own branded portal. See pricing.
Updated 30 October 2026