






Why not just chart it in Excel?
Excel is where most numbers start, and for one-off charts it is hard to beat. It gets harder when the same workbook arrives every week, when several people need the same view, when a question crosses three sheets, or when the chart has to update itself. That is the gap Klyrova fills: the spreadsheet stays your source, and the dashboard stays live.
Upload it
Create a bucket (a folder of files Klyrova can query) and drop in .xlsx or .xls workbooks, up to 20 MB each, alongside CSV and JSON files. Klyrova reads every sheet and makes it a table named after it. Each column gets the narrowest type every value fits:
- whole numbers and decimals, including "1,200", "$3,000.25" and "12%";
- dates and times in many formats;
- yes and no, true and false, as true or false;
- text for everything else.
Money keeps its exact decimals, so totals add up to the penny. A sheet can hold up to 250,000 rows; for bigger data, save it as CSV, which can be up to 500 MB (see CSV to dashboard).
Ask, then keep the answer
"From the sales workbook: revenue by region by month this year, and the ten customers who bought the most."
Klyrova joined the Orders and Customers sheets on the customer id, added up revenue by region and month, and answered with a line chart and a table of the top ten.
Ask Klyrova to build a dashboard from it, with filters for region and dates, or build a report yourself in the report builder, maps included. Questions can join sheets to each other, and, in a data model, to tables in your database.
Replace the file, keep the dashboard
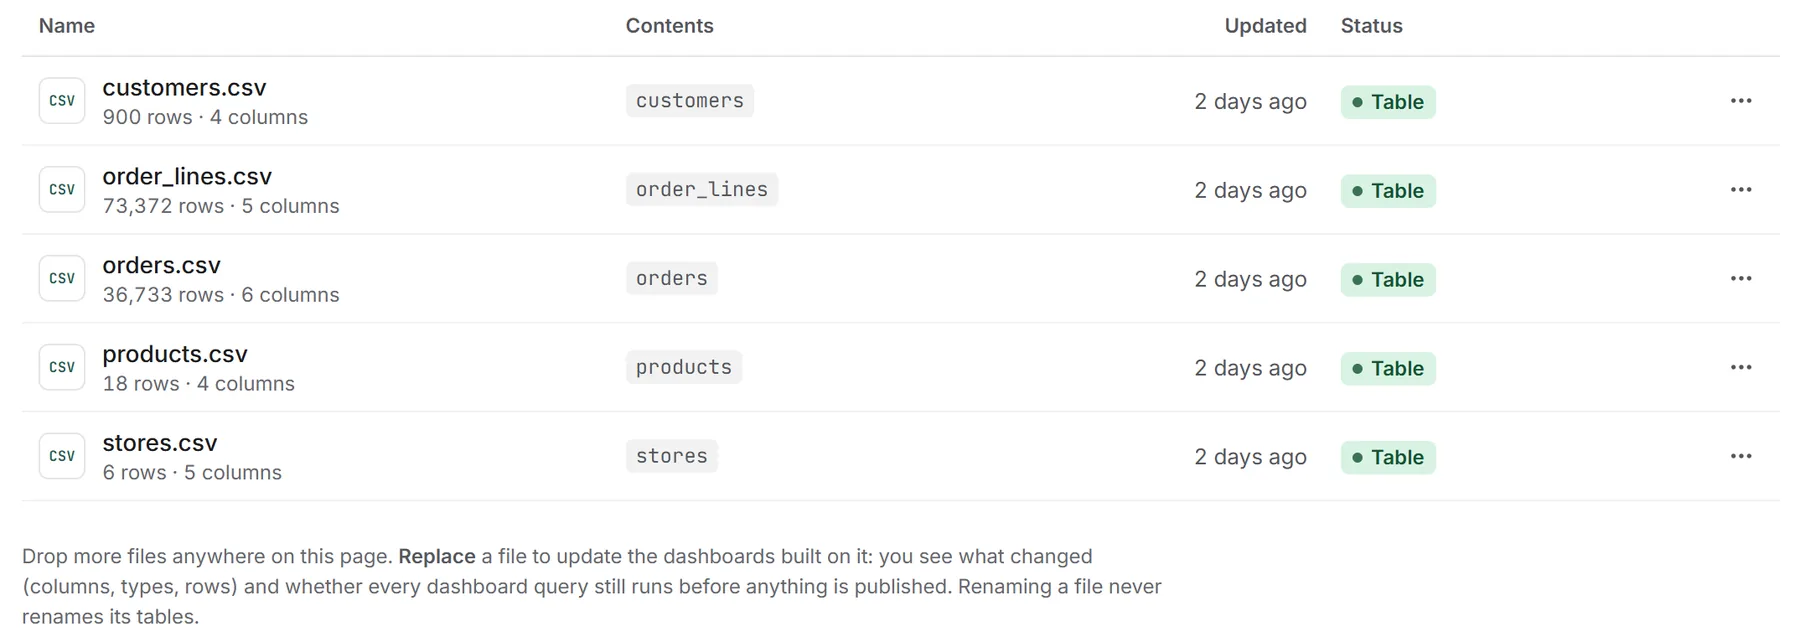
When a new version of the workbook arrives, choose Replace on the file. Before anything changes, Klyrova rebuilds the tables on a scratch copy and shows you what is different: columns added or removed, a type that changed, how many rows each sheet has now. It also re-runs every dashboard query that reads those sheets, so you see which would break before you publish. Then publish, and every dashboard on the file refreshes.
Back out to Excel
Any section of a dashboard exports to Excel (a real workbook with typed numbers and dates, a frozen header and filters) or CSV. On Pro and Teams you can export every underlying row, not only what the chart shows.
Questions about Excel to dashboard
How big can an Excel file be?
Up to 20 MB a file and 250,000 rows a sheet. CSV files can be up to 500 MB.
Does every sheet become a table?
Yes. Each sheet with data becomes a table named after the sheet.
Do formulas come across?
Their results do: Klyrova reads the values the sheet shows. Measures you want to keep can be written once in a data model.
What happens when I upload next month's file?
Replace the old file. Klyrova shows what changed and which dashboards would break before it publishes, then refreshes them.
Is my spreadsheet private?
Files are stored in your account in Azure and read only by you and the people you share dashboards with. See the security page.
Updated 14 November 2026