






AI and analytics
- AI dashboard
- A dashboard that an AI agent builds from a request in plain language, choosing the queries, charts and filters. In Klyrova every chart keeps the query behind it and refreshes by replaying it, without the AI. See AI dashboards.
- AI report
- A report written or assembled by an AI from your data, usually refreshed on a schedule and exported or shared. See AI reports and the AI report builder.
- AI business intelligence
- Business intelligence where an AI agent does the querying, charting and explaining, while the numbers still come from the company's own data. See AI business intelligence.
- AI data analyst
- An AI agent that answers questions about data the way an analyst would: it looks at the schema, runs queries, checks the result and explains it, and keeps the context for follow-up questions. See AI data analyst.
- Text to SQL
- Turning a question in natural language into a SQL query a database can run; also called natural language to SQL or NL2SQL. See text to SQL.
- Natural language query
- Asking a data tool a question in everyday words rather than a query language or a drag-and-drop builder.
Modelling data
- Semantic layer
- A shared set of business definitions (tables, how they join, and measures such as revenue) that every chart and question uses, so a number means the same thing everywhere. See semantic layer.
- Data model
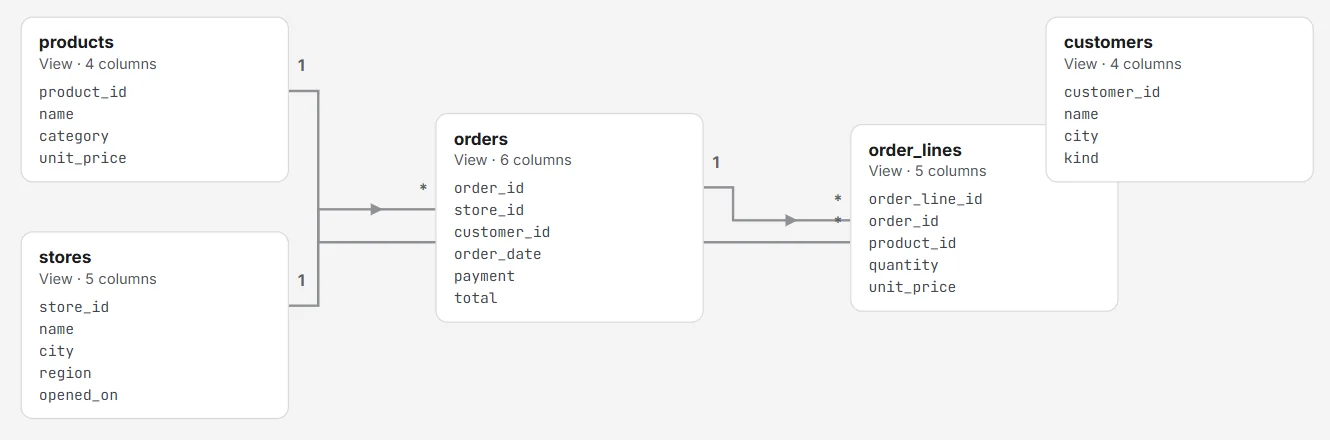
- The tables a dashboard or report is built on, with the relationships between them and the measures defined on them. In Klyrova it is drawn as a diagram you can connect tables on.
- Measure
- A calculation that adds up rows, such as total revenue, number of orders or average order value, defined once and reused by every chart.
- Dimension
- A column you group or filter by, such as region, product category or month, as opposed to the numbers you add up.
- Relationship
- A link between two tables through matching columns, such as orders to customers by customer id. Its cardinality says how many rows match on each side: one-to-many, one-to-one or many-to-many.
- Data transformation
- Cleaning and reshaping data before it is charted: filtering, joining, grouping, pivoting and adding columns; the "T" in ETL. See data transformation.
- ETL
- Extract, transform, load: copying data out of its source, reshaping it, and loading it somewhere else for analysis.
Keeping data current
- Live query
- A chart that reads the database directly each time it refreshes, so it shows the data as it is now. A connected app such as Jira is read live the same way: Klyrova reads the tables picked from it afresh each time.
- Import mode
- Copying a data model's tables into a fast store on a schedule, so filters and refreshes answer in milliseconds; Klyrova imports up to eight set times a day on Pro and Teams, from a database or from a connected app such as Jira.
- Scheduled refresh
- Running a dashboard's queries again at set intervals without anyone opening it.
- Dataset
- In Klyrova, the named, stored query behind a part of a dashboard, together with its last rows.
- Read-only database user
- A database login that can read tables but not change them, the safest way to connect any analytics tool. See the guide.
Showing and sharing
- KPI
- Key performance indicator: a headline figure a team tracks, such as monthly revenue or open tickets, often shown against a target or the previous period.
- Filter or slicer
- A control that narrows every chart on a page to the values picked, such as one region or the last 30 days.
- Drill down
- Moving from a summary to more detail, such as from years to quarters to months on a date axis.
- Choropleth map
- A map where each region is shaded by a value. See map dashboards.
- Embedded analytics
- Dashboards shown inside another product or website, usually in an iframe. See embedded analytics.
- White-label analytics
- Dashboards offered under your own brand: your name, logo, colours and address. See white-label AI dashboards.
Questions about these terms
What is the difference between a dashboard and a report?
A dashboard is usually one live screen of key figures and charts for monitoring; a report is often longer, more detailed, and shared or exported on a schedule. In Klyrova both are live and both can be shared, published and exported.
What is the difference between a measure and a dimension?
A measure is a number you add up, such as revenue; a dimension is what you group or filter it by, such as region or month.
Is live or imported data better?
Live data is always current but as fast as your database. Imported data answers much faster but is as fresh as its last import. Klyrova offers both.
Updated 16 November 2026