






What CSV to dashboard means here
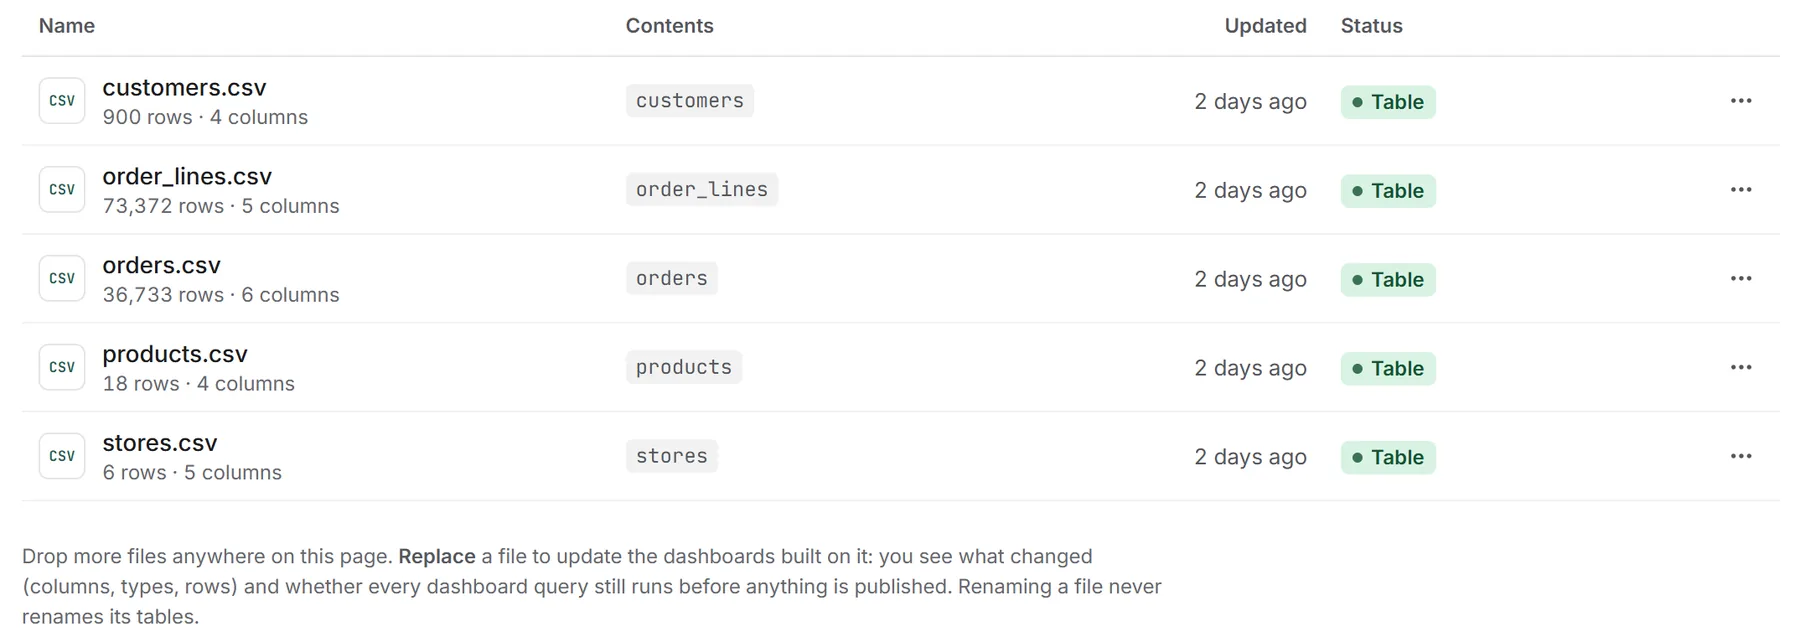
Turning a CSV into a dashboard usually means importing the file into a BI tool, fixing the column types by hand and building each chart yourself. In Klyrova you upload the file to a bucket, a data source made of files, and every CSV, Excel sheet and JSON array in it becomes a database table with real types. Then you ask Klyrova's agent for the dashboard in plain language, and it writes the queries and the page.
The dashboard isn't a picture of the file. Each chart keeps the query that drew it, so the dashboard refreshes from whatever the bucket holds now, and replacing the file is the whole monthly update.
What you can upload
| File | What Klyrova makes of it |
|---|---|
| CSV, TSV | A table, up to 500 MB a file. Large files go up in pieces, so a dropped connection carries on where it stopped. |
| Excel (.xlsx, .xlsm, .xls) | One table per sheet, up to 20 MB a workbook and 250,000 rows on a sheet. A bigger workbook is better uploaded as one CSV per sheet. |
| JSON | A table from an array of records, up to 20 MB. |
| PDF, Word, text | The text, which the agent can read and quote, for the context a spreadsheet doesn't carry. |
| Images | Kept as they are: the agent can look at them, and place them on a dashboard, such as product photos beside a sales table. |
Types are worked out for you
Spreadsheets store everything as text with formatting on top. Klyrova reads every value in a column and gives it the narrowest type that all of them fit:
- Numbers written the way people write them:
1,200,$3,000.25,12%. Amounts that allow it are stored as exact decimals, so a column of prices adds up to the cent instead of to 17448.99999999998. - Dates and date-times in the common formats, stored as real dates so "by month" and "last 90 days" work.
- Yes/no columns as booleans.
- Everything else as text.
Column names become plain lower-case identifiers (Order Date becomes order_date), the delimiter is detected, and files that aren't UTF-8 are still read. Under the hood each bucket is a single DuckDB database, a columnar engine built for this kind of analysis, so an aggregate over millions of rows comes back quickly.
Ask for the dashboard
"From the sales export: monthly revenue for the year, revenue by product category, and the twenty biggest orders, with a filter for region."
The agent read the table's columns, saw order_date was a date and amount a decimal, and wrote three queries and a page: a monthly bar chart, a category breakdown and a table of the largest orders, all following a region filter whose choices come from the file itself.
From there it's the same as any Klyrova dashboard: ask for changes in words, refresh it, share it, export a section back to Excel or CSV, or export the whole page as a PDF.
Replace the file without breaking anything
The hard part of spreadsheet dashboards is next month. A column gets renamed, a sheet goes missing, and a chart quietly shows nothing. Klyrova makes replacing a file a two-step job:
- A dry run. The new file is loaded into a scratch copy of the bucket under the old table names. Klyrova shows which columns were added, removed or changed type, how the row counts moved, and re-runs every dashboard query that reads the file against the new data, marking each one as working or failing.
- Publish. Only when you're happy does the new file replace the old one. Every dashboard that uses it refreshes, and the people who can see those dashboards are told it changed.
New columns are harmless. A removed column shows up as a failing chart before anything is published, not after a colleague opens the dashboard. Renaming a file never renames its tables, so dashboards keep working.
When to use a database instead
Files are the quickest way in, and plenty of teams run on monthly exports. If the data already lives in PostgreSQL, SQL Server, Azure SQL or Microsoft Fabric, connect it directly and dashboards read the source itself, with no export step. You can do both: one dashboard can show charts from a bucket beside charts from a database. See PostgreSQL and SQL Server.
Plans and storage
The Free plan includes one bucket with 100 MB of storage. Pro includes five buckets and 3 GB, and Teams the same for each person. Storage counts the files you upload and any data model you import into Klyrova. See pricing.
Questions about CSV and Excel dashboards
How big a CSV file can I turn into a dashboard?
Up to 500 MB a file. Files of 16 MB or more are uploaded in pieces and resume if the connection drops. Other files, including Excel workbooks and JSON, can be up to 20 MB.
Can I build one dashboard from several spreadsheets?
Yes. A bucket can hold many files, each becoming one or more tables, and the agent can join them in a query, such as orders from one file and customers from another.
What happens when I upload a new version of the file?
Replace the file and Klyrova first runs a dry run: it compares the columns and row counts and re-runs every dashboard query that reads the file. You publish the new version only once you've seen the result, and the dashboards then refresh.
Do I need to clean up the spreadsheet first?
Usually not. Numbers with thousands separators, currency signs and percentages, common date formats and yes/no values are recognised. A sheet with a title block above the headers, or several tables on one sheet, is worth tidying first.
Does Klyrova keep my files?
Yes, in your bucket until you remove them, stored in Klyrova's cloud storage. The privacy policy says where and for how long.
Updated 14 November 2026