






What an AI report builder is
An AI report builder is a reporting tool where an AI agent can do the building for you: you describe a page ("revenue by region as a map, the monthly trend under it, and a table of the biggest orders"), and the agent picks the visuals, the fields and the filters. A good one doesn't stop at a picture. Every visual should stay connected to the data, keep refreshing, and stay editable by a person afterwards.
Klyrova offers two ways to build. Dashboards that Klyrova writes are free-form pages designed for your data. Reports built by hand (in beta) are the studio described here: a grid of visuals you place yourself, on the same data model, with the agent beside you whenever you want it.
The studio
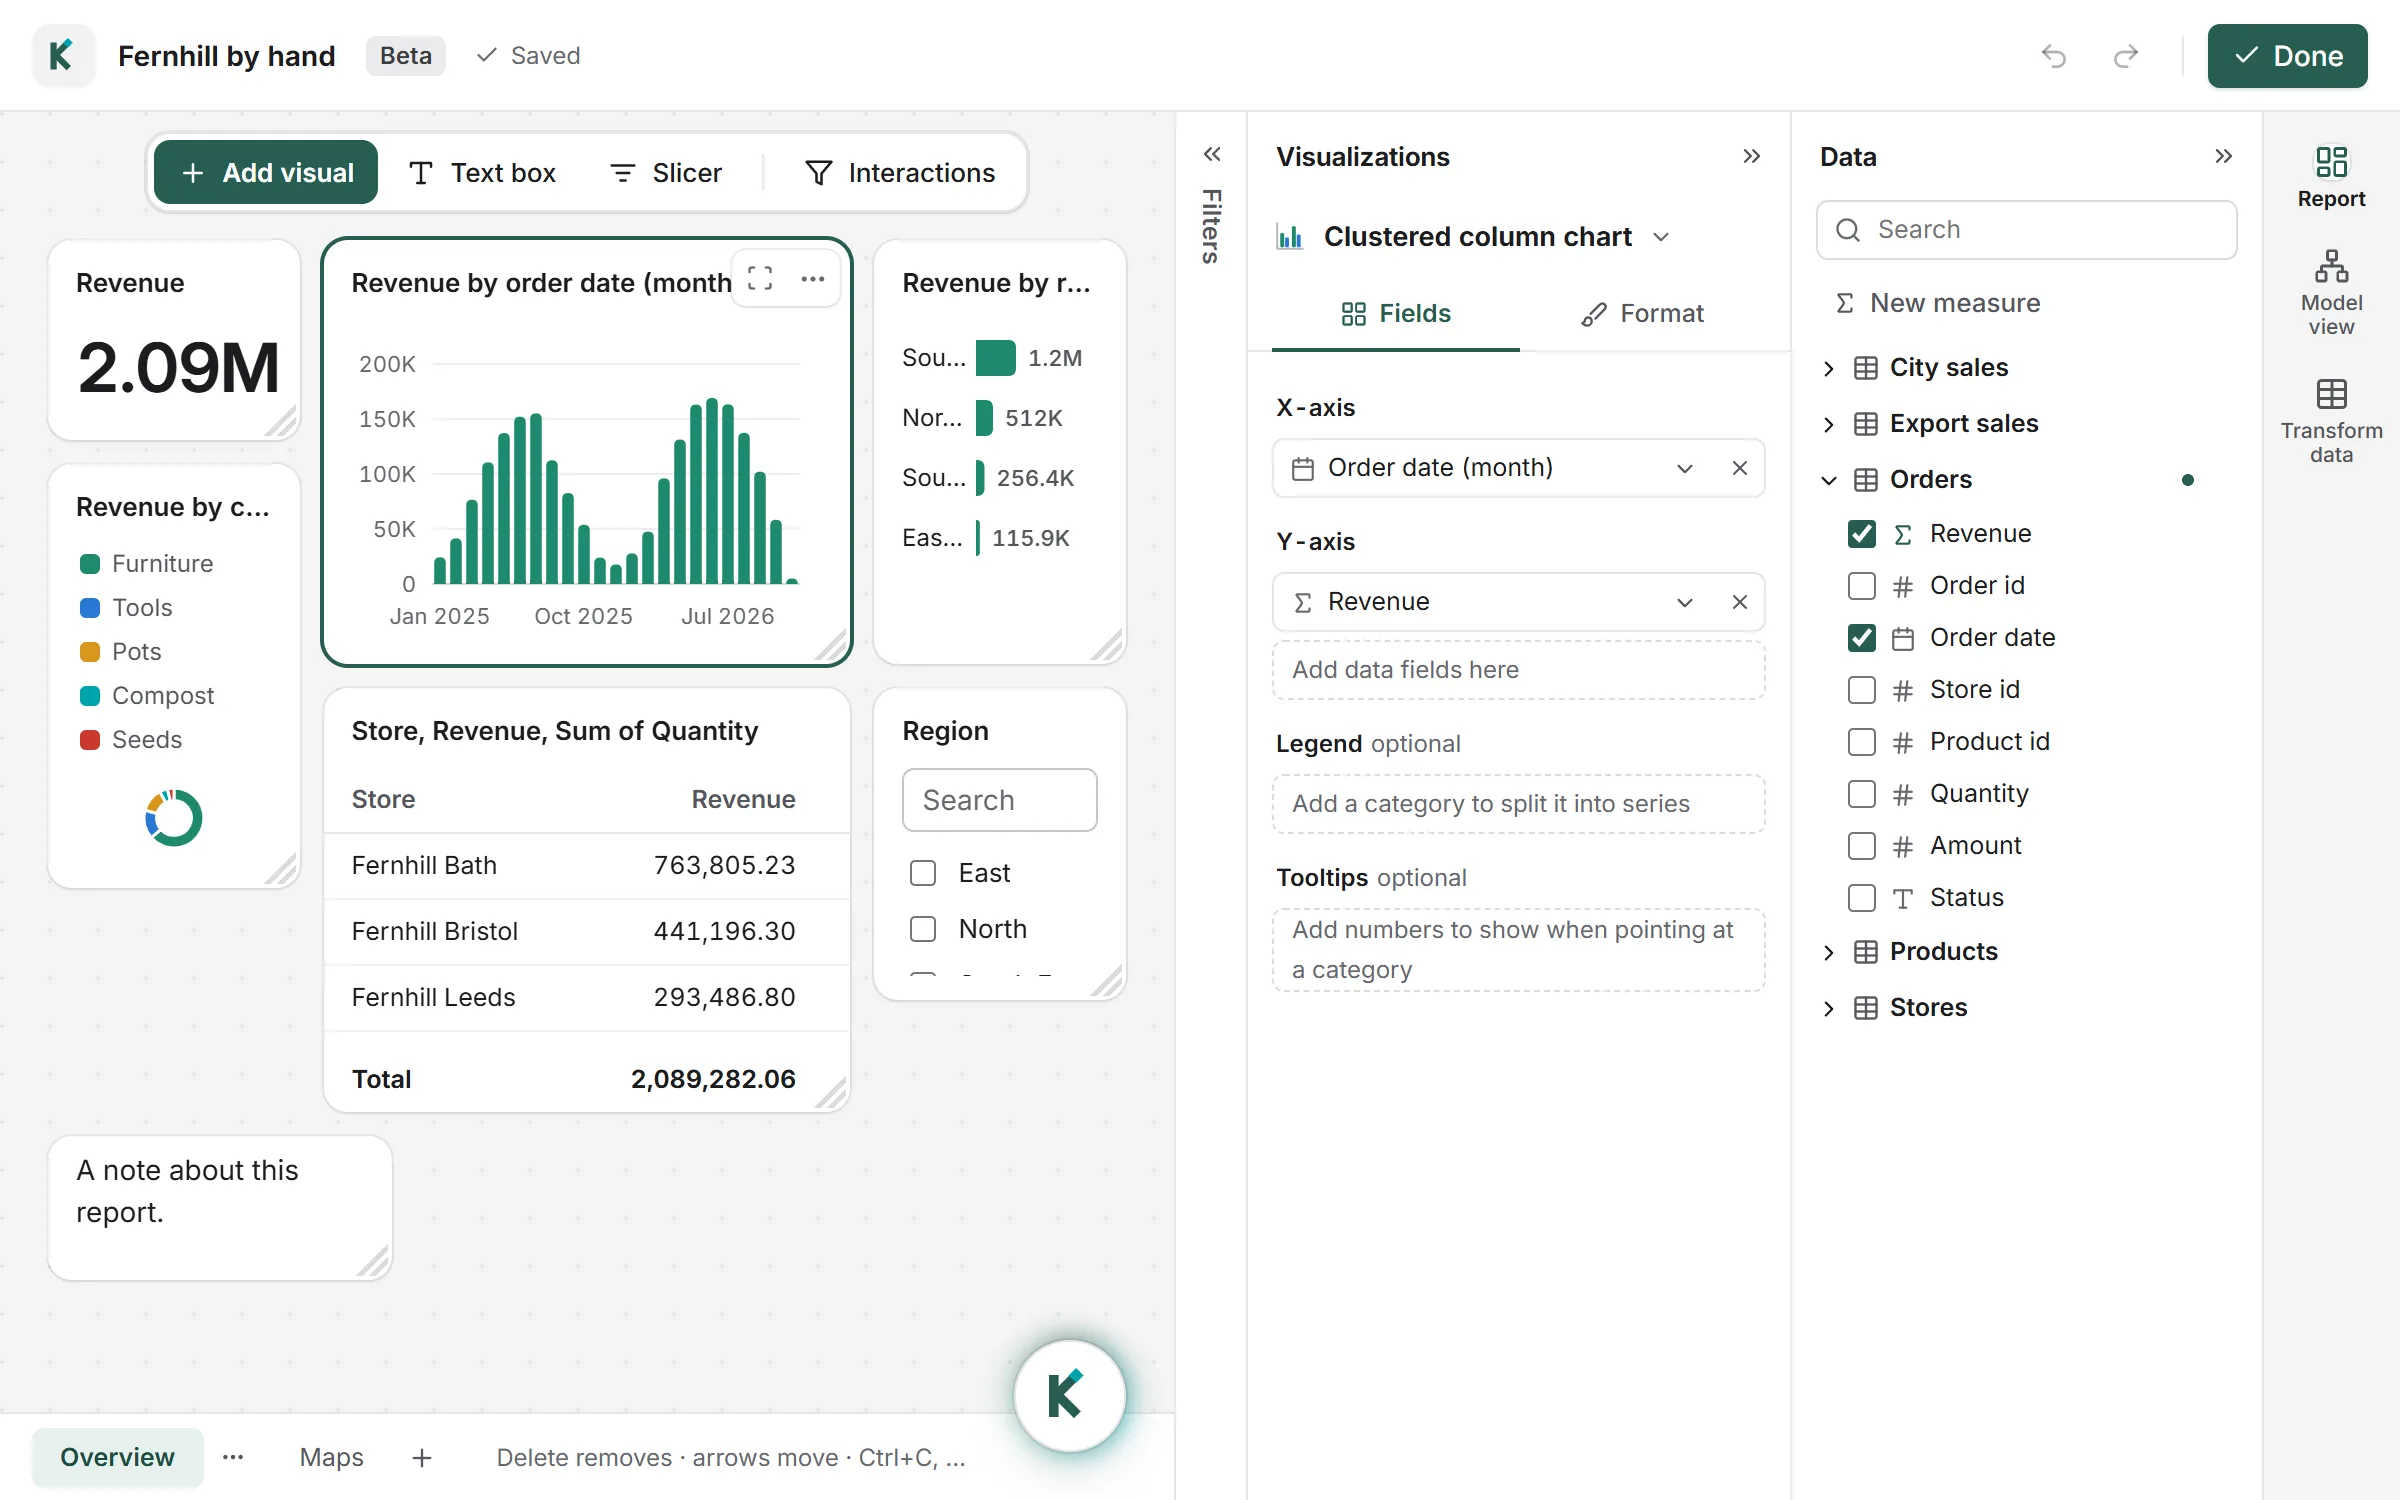
Choose Build it myself when you create a dashboard, and the report opens in edit mode over the whole screen. The page sits in the middle; on the right are three panes that fold away from a click on their heading:
- Filters: filters on the chosen visual and on the whole report. Pick values, write conditions, use relative dates such as "the last 30 days", or keep the top ten by a measure.
- Visualizations: the visual types to add, then the chosen visual's fields and its format: titles, axes, data labels, colours, reference lines and conditional formatting.
- Data: your data model's tables, measures and columns. Tick a field to place it, or drag it onto a visual, a slot or an empty spot on the page.
A rail at the right edge switches between the report, Model view (the diagram of your tables, where you connect them by dragging one column onto another) and Transform data (filter, merge, group and add columns without code). Undo and redo keep up to 50 steps, and every change saves itself a moment after you make it.
26 visual types, maps included
Cards, multi-row cards and KPIs; clustered, stacked and 100% stacked column, bar and area charts; lines; line-and-column combos; waterfalls; funnels; pies, donuts and treemaps; scatter charts with bubble sizes; gauges; tables with totals; matrices with subtotals; slicers; text boxes; and maps that fill countries and states or place cities and coordinates. A click on a bar, a slice or a place filters the rest of the page, and you decide which visuals follow which.
Reports can have several pages, with tabs along the bottom. Charts over dates drill from years to quarters, months and days. A value can be shown as a running total, a share of the total or the change from the previous period.
Ask the agent while you build
Klyrova's agent stays in reach in the studio. Ask it to "add a card with this year's revenue", "turn the bar chart into a map of countries", "put the table on its own page" or "add a measure for average order value", and it makes the change on the canvas in front of you, through the same path your own edits take. Ctrl+Z takes its change back like any other. It can also connect tables, set a field's format and build Transform data steps.
On a data model you trust
Reports read a data model: named tables, relationships and measures written once, as formulas in a familiar spreadsheet style (SUM, DIVIDE, IF, CALCULATE and more). Every report and dashboard on the model uses the same definition of revenue. The queries behind each visual run against your database, read-only, or against a fast imported copy on Pro and Teams.
Share it, publish it, export it
Share a report with viewers and editors, publish it for embedding on Pro and Teams, export any visual's rows to Excel or CSV, or the whole page to PDF. Reports refresh on the dashboard's schedule.
Questions about the report builder
Do I need to know SQL or a formula language?
No. You build visuals by ticking and dragging fields, and Klyrova writes the queries. Measures can be written as formulas if you want them, or you can ask the agent to write one.
How many visual types are there?
26, including tables, matrices, maps, waterfalls, funnels, gauges, KPIs, scatter charts and combo charts, plus slicers and text boxes.
Can I mix building by hand and asking the AI?
Yes. The agent works in the same report: what it adds can be edited by hand, and what you build it can change when you ask.
Which data can a report use?
Any data source in your data model: PostgreSQL, SQL Server, Azure SQL, Microsoft Fabric, uploaded CSV, Excel and JSON files, and apps such as Jira, Smartsheet or any REST API.
Is the report builder free?
Building reports by hand uses no AI credits, and it is included on every plan, Free included. Asking the agent uses credits. See pricing.
Updated 14 November 2026